Best Synthetic Monitoring Tools in 2026: 9 Tools Compared
Compare the best synthetic monitoring tools for 2026, from Datadog and Checkly to Pingdom and Grafana, with pricing, browser checks and alerting compared.
- Editor's choice
 Datadog Synthetics
Teams already running Datadog observability
Starts atSee websiteVisit datadoghq.comFull review - Great alternative
 Checkly
Developers who treat checks as code
Starts at$24 per monthVisit checklyhq.comFull review - Also consider
 New Relic Synthetics
Teams that want a generous free tier
Starts atFreeVisit newrelic.comFull review
TL;DR:
- Datadog Synthetics is our pick for teams already using Datadog, because failed browser journeys sit next to traces, logs and dashboards.
- Checkly is the best fit for developers who want monitoring as code, with Playwright checks stored in a repository and run from many locations.
- Pingdom and Site24x7 suit smaller teams that want simple uptime and transaction checks without a full observability platform.
- New Relic and Grafana Cloud offer generous free tiers, which makes them strong starting points for a team testing synthetic monitoring for the first time.
- Catchpoint and Dynatrace suit large enterprises that need many global locations, private agents and deep performance analysis, at enterprise prices.
Quick comparison
| Tool | Best for | Starts at | Free plan? | |
|---|---|---|---|---|
| Datadog Synthetics | Teams already running Datadog observability | See website | No | Visit |
| Checkly | Developers who treat checks as code | $24 per month | Yes | Visit |
| New Relic Synthetics | Teams that want a generous free tier | Free | Yes | Visit |
 Dynatrace Synthetic | Large enterprises with complex applications | See website | Free trial | Visit |
 Pingdom | Simple, reliable uptime and transaction checks | $15 per month | No | Visit |
 Site24x7 | Teams that want website, server and cloud monitoring together | $9 per month | Yes | Visit |
 Grafana Cloud Synthetic Monitoring | Teams already using Grafana and k6 | Free | Yes | Visit |
 Catchpoint | Enterprises needing global and last-mile visibility | See website | No | Visit |
 Better Stack | Small teams that want synthetics plus on-call in one tool | $29 per month | Yes | Visit |
The best synthetic monitoring tools
Synthetic monitoring simulates a user: it loads pages, clicks through checkout, calls APIs and reports failures before real customers hit them. That differs from uptime pinging, which only checks that a server answers. We compared browser and API checks, global locations, alerting, pricing models and how each tool fits a team that already uses other monitoring software.
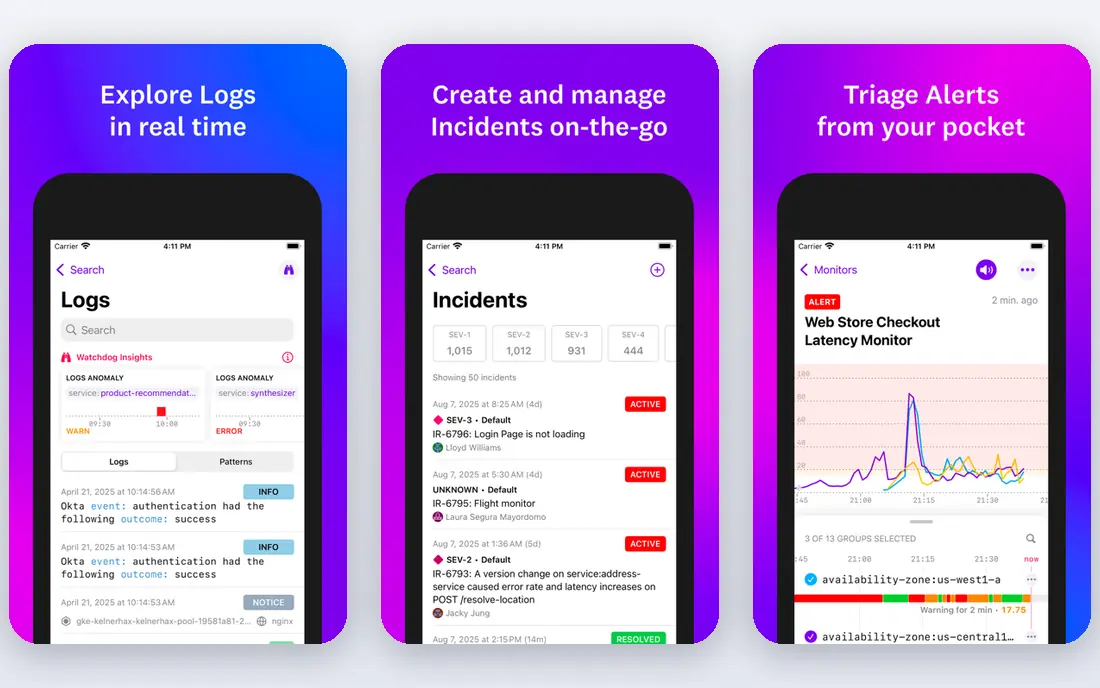
Datadog Synthetics lets you record a multi-step browser journey or build API tests, then run them on a schedule from managed or private locations. When a test fails, the result links to related traces, logs and network data, which shortens the step from alert to cause. That integration is the reason to choose Datadog over a standalone checker, especially for a team that already pays for its infrastructure and application monitoring.
The pricing model needs care. Browser tests are billed per run, at around $12 per 1,000 browser runs, and a test running every minute from several locations quickly becomes hundreds of thousands of runs per month. Small teams should start with fewer locations and longer intervals, then increase frequency only for checkout and login flows that justify the cost.
- Browser and API tests in one platform
- Failed runs link to traces and logs
- Many managed locations
- Per-run pricing can climb fast
- Platform complexity for small teams
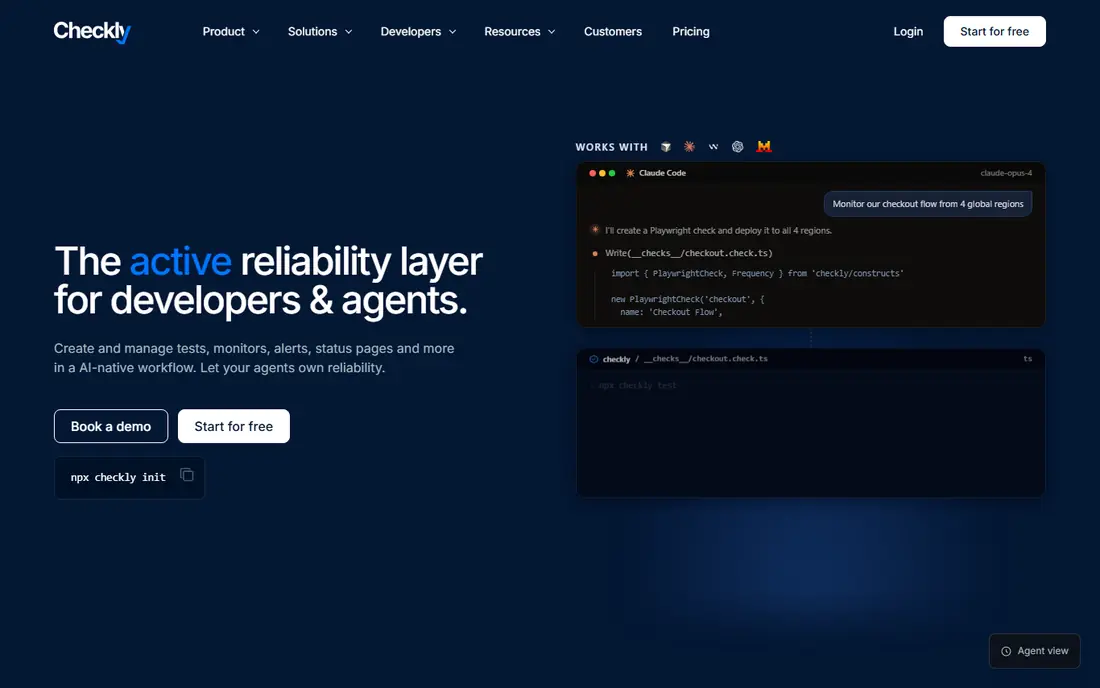
Checkly appeals to engineering teams because checks are code, not clicks in a dashboard. You write Playwright browser checks and API checks, store them in a repository, review them like any other code change and deploy them through the same pipeline. That approach keeps monitoring in step with the application, so a new checkout step gets a new check in the same pull request.
The free tier covers basic use, and paid plans start at $24 per month. There is no drag-and-drop recorder, so a non-technical team may prefer Site24x7 or Pingdom. For a developer-led team, though, Checkly's model is cleaner: fewer dashboard-only checks that nobody remembers, and a clear history of what changed and when.
- Playwright browser checks
- Checks live in Git
- Clear alerting and status pages
- No visual recorder
- Run volume still affects cost
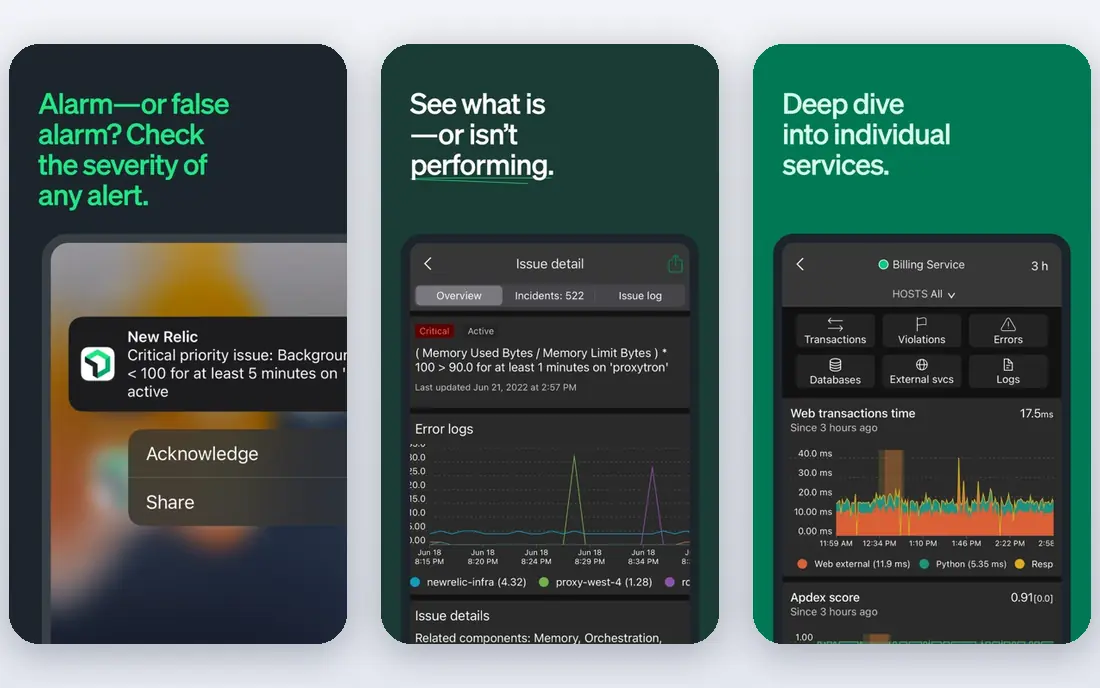
New Relic Synthetics covers ping, simple browser and scripted browser monitors, plus API tests, inside a platform where every feature is available on every plan. The free tier, with 100 GB of monthly data ingest and one full-platform user, is genuinely useful for a small team, and it lets you test synthetic monitoring without a purchase order. Results appear alongside application performance, infrastructure and log data.
The catch is user pricing as the team grows. Full-platform users are billed per seat, so a large team can face a steep bill even before data charges. Small teams and solo developers will find the free tier hard to beat, while larger teams should model user counts carefully. Scripted monitors also assume comfort with Selenium-style scripting, which suits engineers more than marketers.
- Free tier with 100 GB of data per month
- Scripted and simple browser monitors
- Unified platform
- Full-platform user pricing at higher tiers
- Scripted monitors need Selenium knowledge
Dynatrace Synthetic is built for organizations that run many applications across regions and need to prove performance from the user's location, not just from a data center. It supports recorded browser clickpaths, HTTP monitors and private synthetic locations inside a corporate network, with results feeding into Dynatrace's broader analysis of problems and their causes. That breadth suits banks, retailers and SaaS vendors with strict performance targets.
The trade-off is cost and complexity. Dynatrace uses a consumption-based platform subscription, so pricing is quoted and usually involves an annual commitment. Setup and tuning also take longer than a simple uptime tool. A small team will find it heavy, but an enterprise team that already uses Dynatrace will get more value here than from bolting on a separate checker.
- Many public and private locations
- Recorded clickpaths
- AI-assisted root cause analysis
- Enterprise pricing and commitment
- Steep learning curve
Pingdom has been a straightforward website monitoring tool for years, and that focus is its strength. You can set up uptime checks, page speed checks and recorded multi-step transactions in minutes, with alerts by email, SMS and integrations. It runs checks from more than 100 locations, so a failure report usually tells you whether the problem is global or regional. For a small business or agency watching client sites, that simplicity is enough.
The limits are scope and price structure. There is no free plan, only a trial, and paid plans start at $15 per month for 10 monitors, rising with monitor count. Pingdom does not monitor servers, databases or application internals, so a team that needs full observability should pair it with another tool or choose Datadog, New Relic or Site24x7 instead.
- Easy setup
- Recorded transaction checks
- Clear alerts and status pages
- No free plan
- Limited depth compared with full observability suites
Site24x7, part of Zoho, bundles website monitoring with server, network, cloud and application monitoring, which makes it a good single purchase for a small IT team. Its synthetic side includes website checks, REST API monitors and recorded web transactions in Chrome, Firefox and Edge, run from more than 130 locations. The free tier covers up to five monitors, and paid website monitoring starts at $9 per month.
The honest catch is that the $9 pack does not cover everything. Browser transaction checks sit on higher tiers, starting around $36 per month in some comparisons, so price the exact check type you need rather than the headline plan. The dashboard also packs many modules into one screen, which can feel busy at first. For a team that wants one vendor for most monitoring, that breadth is still a fair trade.
- Broad suite beyond synthetics
- Recorded web transactions
- Many global locations
- Large suite can feel busy
- Browser journeys cost more than basic monitors
Grafana Cloud Synthetic Monitoring runs HTTP, multi-step HTTP and k6 browser checks from public and private locations, with results shown in Grafana dashboards alongside metrics, logs and traces. If your team already writes k6 load tests, reusing those scripts for synthetic checks is efficient, and the free tier makes it easy to start. The Pro tier starts around $29 per month plus usage, so costs scale with check volume rather than seats.
The learning curve is the main barrier. There is no point-and-click recorder, and getting the most from the tool assumes familiarity with Grafana, alert rules and k6 scripting. A team without that background may move faster with Checkly or Pingdom. For a Grafana shop, though, keeping synthetic results in the same dashboards as everything else is a clear win.
- Free tier included
- K6 scripted checks
- Results in familiar Grafana dashboards
- No visual recorder
- Comfort with Grafana helps a lot
Catchpoint stands out on coverage, with more than 1,400 test agents including backbone, cloud, enterprise and last-mile locations that show performance from real user networks, not just data centers. It supports Playwright and Selenium browser tests, many API protocols and detailed network diagnostics, which helps large companies find whether a slowdown comes from their code, a CDN or an internet provider. That depth is why global retailers, media companies and SaaS vendors use it.
Pricing is quoted, and the product is priced for enterprises, so a small business should look elsewhere. Setup also assumes a team that will invest in test design and analysis. For an organization where a few seconds of latency across regions costs real revenue, Catchpoint's coverage and diagnostics justify the enterprise conversation.
- Very large global agent network
- Playwright and Selenium support
- Deep network diagnostics
- Quoted enterprise pricing
- Overkill for small sites
Better Stack
Best for: Small teams that want synthetics plus on-call in one tool
Better Stack combines synthetic monitoring with logs, incident management, on-call scheduling and status pages, so a small team can run the whole reliability workflow without four vendors. Its checks include Playwright browser tests and HTTP, keyword and port checks, with alerts and a public status page included. The interface is clean, and setup is faster than in the large observability suites.
Pricing starts around $29 per responder per month, with browser runtime billed on top, so model browser minutes before committing to frequent checks. Location coverage is smaller than Catchpoint or Dynatrace, which matters less for a team serving one or two regions. For a startup or agency that wants one bill for monitoring and incident response, Better Stack is a strong, modern choice.
- Playwright checks
- Logs, status pages and on-call included
- Clean interface
- Browser minutes billed on top
- Fewer locations than enterprise rivals
How we picked these
We compared official feature and pricing pages, public comparisons and documentation for each tool, focusing on browser and API check types, location coverage, alerting, pricing models and fit for different team sizes. We favored tools that are actively sold and supported in October 2026 and that represent different approaches, from developer-led monitoring as code to enterprise global networks. We did not claim hands-on testing, and per-run pricing means totals depend heavily on check frequency and locations.
How to design synthetic checks that actually help
Start with the journeys that cost money when they break: login, search, add to cart, checkout and payment confirmation. A check that only pings the homepage will miss a broken checkout button, which is the failure customers notice first. Write one check per critical journey, keep each check short, and assert on content that proves the step worked, such as an order confirmation message, not just a 200 status code.
Control cost by tuning frequency and locations
Per-run and per-minute pricing punishes thoughtless settings. Run critical journeys every one to five minutes from two or three locations that match your audience, and run less critical pages every ten to fifteen minutes from one location. Review run volume monthly, and drop checks that have never failed or that duplicate another check. A smaller set of meaningful checks beats a large set of noisy ones, both for cost and for alert fatigue.
Make alerts useful, not noisy
Route synthetic failures to the team that owns the journey, with enough detail to act: which step failed, a screenshot where available, and the region affected. Require two consecutive failures before paging outside working hours, and link each alert to a runbook or recent change. If alerts fire often for flaky third-party widgets, narrow the assertion rather than ignoring the alert, since ignored alerts hide real outages.
FAQ
What is synthetic monitoring software?
Synthetic monitoring software simulates user actions, such as loading pages, logging in and completing checkout, on a schedule from chosen locations. It reports failures and slowdowns before real users encounter them. It differs from real user monitoring, which measures actual visitors, and from simple uptime pinging, which only checks that a server responds.
What is the difference between synthetic monitoring and uptime monitoring?
Uptime monitoring checks whether a site or server responds, usually with a simple HTTP request. Synthetic monitoring goes further by performing multi-step journeys in a real browser or through API calls, so it catches broken buttons, failed logins and slow checkout steps that a ping would miss. Most teams need both, but synthetic checks give earlier warning on user-facing failures.
How much does synthetic monitoring cost?
Costs vary widely by pricing model. Checkly starts at $24 per month, Pingdom at $15 per month and Site24x7 at $9 per month for basic monitors, while Datadog bills browser tests per run at around $12 per 1,000 runs. Enterprise tools such as Catchpoint and Dynatrace are quoted. Always estimate total runs from check frequency, steps and locations before buying.
Do I need browser checks or are API checks enough?
API checks are cheaper and faster, and they suit backend services and endpoints. Browser checks are needed for user-facing journeys, since they catch rendering, JavaScript and third-party script problems that APIs cannot see. Most teams run API checks for services and browser checks for login, checkout and other critical pages.
Can synthetic monitoring replace real user monitoring?
No, the two complement each other. Synthetic checks give consistent, controlled measurements from known locations, which is ideal for alerting and benchmarking. Real user monitoring shows what actual visitors experience across devices, networks and regions. Use synthetics for alerts and regression checks, and real user data to understand the full range of visitor experience.