Best Service for Real-Time Cloud Monitoring in 2026: 8 Services Compared
Find the best service for real-time cloud monitoring, with live metrics, traces, logs and alerts for AWS, Azure, Google Cloud and hybrid infrastructure.
- Editor's choice
 Datadog
All-in-one cloud monitoring
Starts at$15 per host per monthVisit datadoghq.comFull review - Great alternative
 New Relic
Usage-based observability
Starts atFreeVisit newrelic.comFull review - Also consider
 Grafana Cloud
Open-source observability stack
Starts at$19 per monthVisit grafana.comFull review
TL;DR:
- Instrument with OpenTelemetry first, so you can change tools without rewriting code.
- Watch how the bill grows: per host, per user, per gigabyte or per event.
- Set alert thresholds and retention rules on day one to avoid surprise costs.
- Test alerts with a real incident drill before relying on them in production.
Quick comparison
| Tool | Best for | Starts at | Free plan? | |
|---|---|---|---|---|
| Datadog | All-in-one cloud monitoring | $15 per host per month | Free trial | Visit |
| New Relic | Usage-based observability | Free | Yes | Visit |
| Grafana Cloud | Open-source observability stack | $19 per month | Yes | Visit |
 Dynatrace | Enterprise root-cause analysis | $7 per host per month | Free trial | Visit |
 Site24x7 | Budget all-in-one monitoring | $9 per month | Free trial | Visit |
 LogicMonitor | Hybrid and multi-cloud monitoring | $16 per month | Free trial | Visit |
 Splunk Observability Cloud | Streaming real-time analytics | $15 per host per month | Free trial | Visit |
 Amazon CloudWatch | AWS-native monitoring | See website | Yes | Visit |
The best services for real-time cloud monitoring
Real-time monitoring means seeing a problem as it happens, tracing it to a service, and alerting the right person. The tools below cover infrastructure, applications, logs and traces, with different pricing models that matter as you scale.

Datadog fits a growing engineering team that wants one platform for infrastructure, applications, logs and security signals. Its integration catalog covers most cloud services, and linked views help an engineer move from an alert to logs and traces without switching tools.
The bill is the main risk. Host, data and feature charges add up, so teams need retention rules, metric controls and budget alerts from day one. For a team that values one vendor and broad coverage, the depth often justifies the cost.
- Broad integrations
- Metrics, traces and logs in one view
- Strong alerting
- Costs scale fast with hosts and data
- Learning curve is real
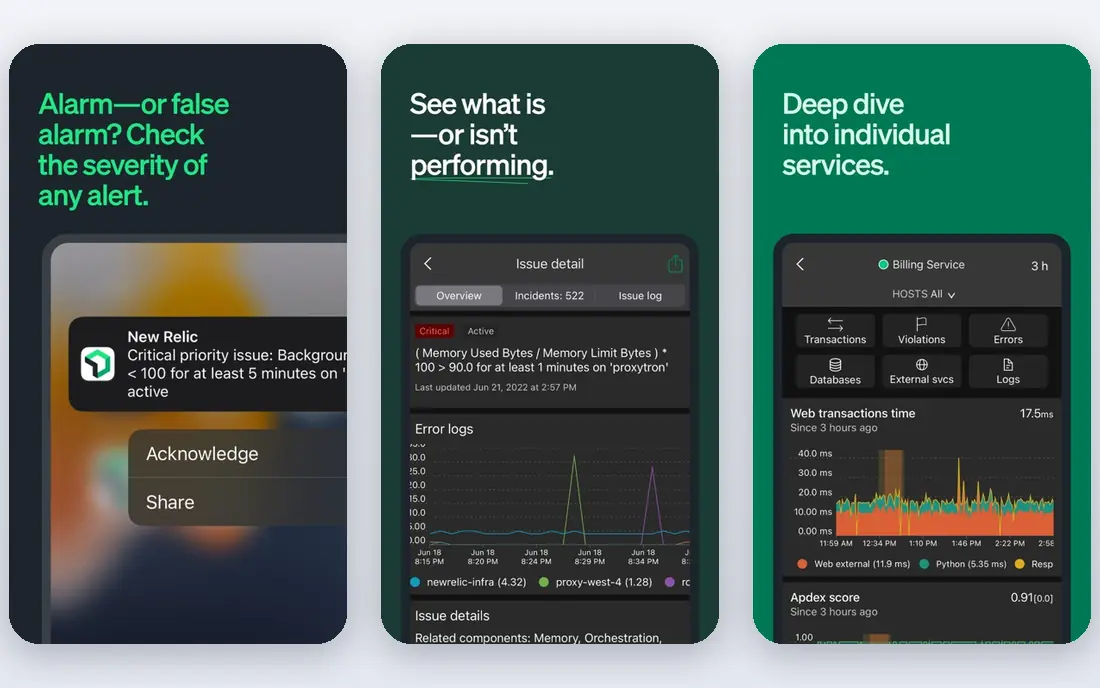
New Relic suits a team that wants a generous free tier and usage-based pricing without per-host fees. Metrics, traces and logs sit in one platform, and small teams can start free while they learn what data they actually need.
The trade-off is data discipline. Ingest beyond the free allowance and full-user seats can raise costs, so teams should set retention and sampling rules early. For startups and small teams, the free start is a strong advantage.
- Free data allowance
- Full-stack views
- User-based pricing
- Full-user seats can be costly
- Data discipline is needed
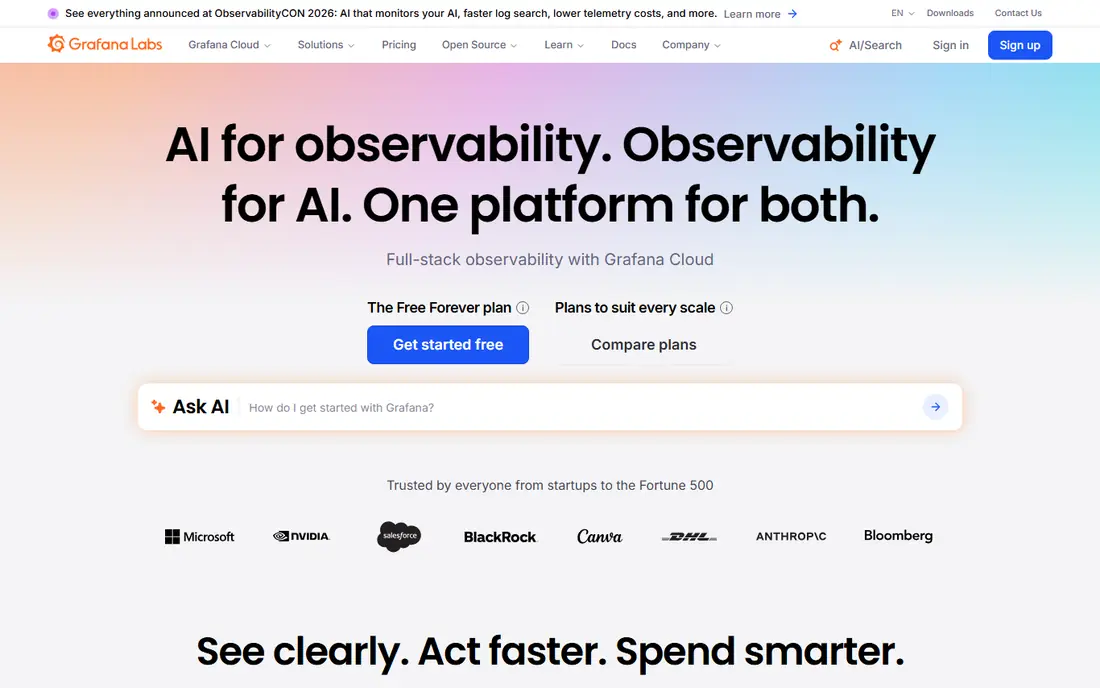
Grafana Cloud fits a team already using Prometheus, Grafana and OpenTelemetry that wants a managed version without running the stack itself. Dashboards are flexible, and the open standards make it easier to move data later.
Usage charges for metrics, logs and traces still need watching, and teams new to Grafana will face a learning curve. For open-source teams, the managed stack saves operations time while keeping standards-based freedom.
- Managed Prometheus stack
- Flexible dashboards
- OpenTelemetry support
- Usage charges add up
- Setup needs Grafana knowledge
Dynatrace suits a large enterprise with complex, hard-to-map services that need automatic root-cause analysis. Automatic instrumentation and topology mapping help teams see dependencies without manual setup for every service.
The pricing model and learning curve are the drawbacks, since full-stack rates vary by host size and features. Large teams that need deep automation will gain the most, while small teams may find it heavy.
- Automatic topology mapping
- AI root-cause analysis
- Auto-instrumentation
- Enterprise pricing complexity
- Steep learning curve
Site24x7 fits a small IT team that needs broad coverage on a tight budget. Website, server, application and network monitoring sit in one low-cost plan, with status pages for customer communication.
The interface feels older than newer rivals, and advanced application tracing is less deep. For a team that needs solid coverage without an enterprise bill, the value is clear.
- Wide coverage for price
- Website, server and app monitoring
- Status pages
- Interface feels dated
- Advanced APM depth is limited
LogicMonitor suits an IT team managing a mix of on-premise and cloud infrastructure. Automatic discovery maps devices and services, and alerting helps a small team cover a large estate without manual inventory work.
Pricing transparency and APM depth are weaker than in the largest observability platforms. Teams with mainly hybrid infrastructure, rather than deep application tracing needs, will find the fit best.
- Hybrid coverage
- Automatic discovery
- Clear alerting
- Pricing is less transparent
- APM depth is limited
Splunk Observability Cloud fits a team that needs streaming, real-time analytics and strong log search at scale, especially inside a Cisco or Splunk estate. Live views help engineers spot spikes and errors as they happen.
The cost and learning curve are real concerns at scale, so teams should pilot with a clear data budget. For log-heavy teams already using Splunk, the shared search skills help adoption.
- Real-time streaming analytics
- Strong log search
- Cisco ecosystem
- Cost can be high at scale
- Learning curve is steep
Amazon CloudWatch fits a team that runs mainly on AWS and wants native monitoring without a new vendor. Metrics, logs and alarms for AWS services work with little setup, and pay-as-you-go pricing matches variable use.
The limit is multi-cloud coverage. Teams running Azure, Google Cloud or on-premise systems will need another tool for a single view. For an AWS-only team, the native fit is hard to beat.
- Native AWS integration
- No extra agent setup for AWS
- Pay as you go
- Weak multi-cloud coverage
- Interface can feel clunky
How we picked these
Our method was practical. We checked official feature pages, pricing pages, free tier terms, integration lists, and public reviews for each service. We favored services that are sold and supported in October 2026, that offer live metrics, logs or traces with alerting, and that cover at least one major cloud well. Pricing models differ sharply, so we note whether a price is per host, per month or usage-based, and we used See website where a single price would mislead.
How to choose a real-time cloud monitoring service
Start with the bill model, not the feature list. A per-host model suits a team with few hosts and many engineers, while a per-user or per-gigabyte model suits a team with many hosts and a small team. Estimate your hosts, data volume and users for the next year, then compare totals, not entry prices. A tool that looks cheap at five hosts can become the most costly at fifty.
Next, check the incident workflow. A good tool should alert the right person, link the alert to traces and logs, and show which deploy or change preceded the problem. Test this with a drill: break a staging service, watch the alert arrive, and time how long it takes to find the cause. If the workflow needs three tools and manual searching, the platform is not doing its job.
Finally, protect your exit and your budget. Use OpenTelemetry for instrumentation where possible, set retention and sampling rules on day one, and set a spending alert at a level you will actually notice. Review dashboards monthly, delete unused alerts, and keep a short runbook for the top five incidents. Monitoring should reduce midnight pages, not create a new set of noisy alerts.
A staging drill is the best way to test a monitoring tool before you depend on it. Break a staging service in a planned way, watch how fast an alert arrives, and time how long it takes to find the cause from the alert alone. Check whether the alert names the affected service, links to traces and logs, and reaches the right on-call person without duplicate pages. Note any noisy alerts that fired for harmless changes, and tune those thresholds before production use. That drill often reveals gaps in routing, retention or dashboard design that a sales demo hides, and it gives the team confidence that the first real incident will be handled with a clear workflow rather than guesswork.
Ownership also matters for a monitoring rollout. Name one owner for dashboards, one for alert rules and one for runbooks, even on a small team, so no alert set drifts without review. Schedule a monthly review to remove alerts that never needed action, update thresholds after a service changes, and archive dashboards for retired services. That routine keeps the tool useful as the system grows, and it prevents the slow build-up of pages that engineers learn to ignore. A monitoring tool with clear owners stays trusted, while a tool with no owner slowly becomes noise that the team works around instead of using.
A short weekly review also keeps monitoring data useful. Spend thirty minutes checking which alerts fired, which ones needed action, and which dashboards the team actually opened. Retire alerts that only describe normal scaling or deploys, and add a runbook link to any alert that caused confusion. That review prevents dashboard sprawl, where every team adds charts no one maintains, and it keeps the on-call rota focused on signals that matter. Over a quarter, those small cleanups add up to fewer pages, faster triage and a monitoring setup the team trusts.
FAQ
What is the difference between monitoring and observability?
Monitoring tracks known metrics and alerts when thresholds break, while observability adds traces and logs that help explain unknown problems. Most modern tools combine both, but the balance varies by vendor.
How much does cloud monitoring cost?
It depends on hosts, data volume, users and retention. Entry prices in this guide start near free or low monthly rates, but large estates can reach thousands per month, so estimate your full scale before buying.
Do I need APM as well as infrastructure monitoring?
Yes, if you run custom applications. Infrastructure monitoring shows host health, while APM shows slow requests, errors and service dependencies inside your code.
What is OpenTelemetry?
OpenTelemetry is an open standard for collecting metrics, traces and logs from applications. Using it helps you send data to different tools without rewriting instrumentation for each vendor.
How do I avoid alert fatigue?
Alert only on user impact, set sensible thresholds, group related alerts, and review noisy alerts weekly. A page should mean action is needed, not only that a metric moved.
How long should we keep monitoring data?
Keep high-detail data for a short period, such as two to four weeks, and longer summaries for trend analysis. That balance controls cost while keeping enough history to compare a new incident with past patterns.