Best Portfolio Analysis Tools in 2026: 9 Tools Compared
Compare the best portfolio analysis tools for 2026, from dividend tracking and backtesting to fund research, with prices and picks for every investor type.
- Editor's choice
 Morningstar Investor
Fund and stock research
Starts at$34.95 per monthVisit morningstar.comFull review - Great alternative
 Sharesight
Dividends and tax reporting
Starts atSee websiteVisit sharesight.comFull review - Also consider
 Stock Rover
Active stock and ETF analysis
Starts atSee websiteVisit stockrover.comFull review
TL;DR:
- Morningstar Investor is our pick for fund research, with Portfolio X-Ray showing allocation, sector weight, fees, and overlap in one view.
- Sharesight is the strongest choice for dividend investors and tax reporting, with transaction-based returns across many brokers and currencies.
- Stock Rover suits active stock and ETF investors who want screeners, detailed reports, and portfolio checks in one place.
- Portfolio Visualizer is the best free-leaning tool for backtesting, factor analysis, and Monte Carlo checks, with paid plans for heavier use.
- Kubera is the pick for complex households holding stocks, property, crypto, and other assets on one balance sheet.
Quick comparison
| Tool | Best for | Starts at | Free plan? | |
|---|---|---|---|---|
| Morningstar Investor | Fund and stock research | $34.95 per month | Free trial | Visit |
| Sharesight | Dividends and tax reporting | See website | Yes | Visit |
| Stock Rover | Active stock and ETF analysis | See website | Free trial | Visit |
 Kubera | Whole balance sheet tracking | $250 per year | Free trial | Visit |
 Portfolio Visualizer | Backtesting and modeling | Free | Yes | Visit |
 Seeking Alpha Premium | Research plus portfolio tracking | See website | Free trial | Visit |
 Yahoo Finance | Everyday monitoring and news | Free | Yes | Visit |
 Ziggma | Portfolio scores and alerts | See website | Yes | Visit |
 Simply Wall St | Company quality and risk views | See website | Yes | Visit |
The best portfolio analysis tools
A good portfolio tool answers four questions without a spreadsheet marathon: what do I own, how is it doing, what does it cost, and where is the risk. The tools below answer those questions in different ways. Some focus on dividends, some on funds, some on backtesting, and some on the whole household balance sheet. We compared pricing pages, feature lists, and broker coverage to match each tool to the investor it serves best.
This is not financial advice, and none of these tools should replace a licensed adviser for a major decision. Past returns shown in any backtest do not predict future returns, and trading carries risk. Use these tools to understand your portfolio, then decide with a clear view of fees, taxes, and your own time horizon.
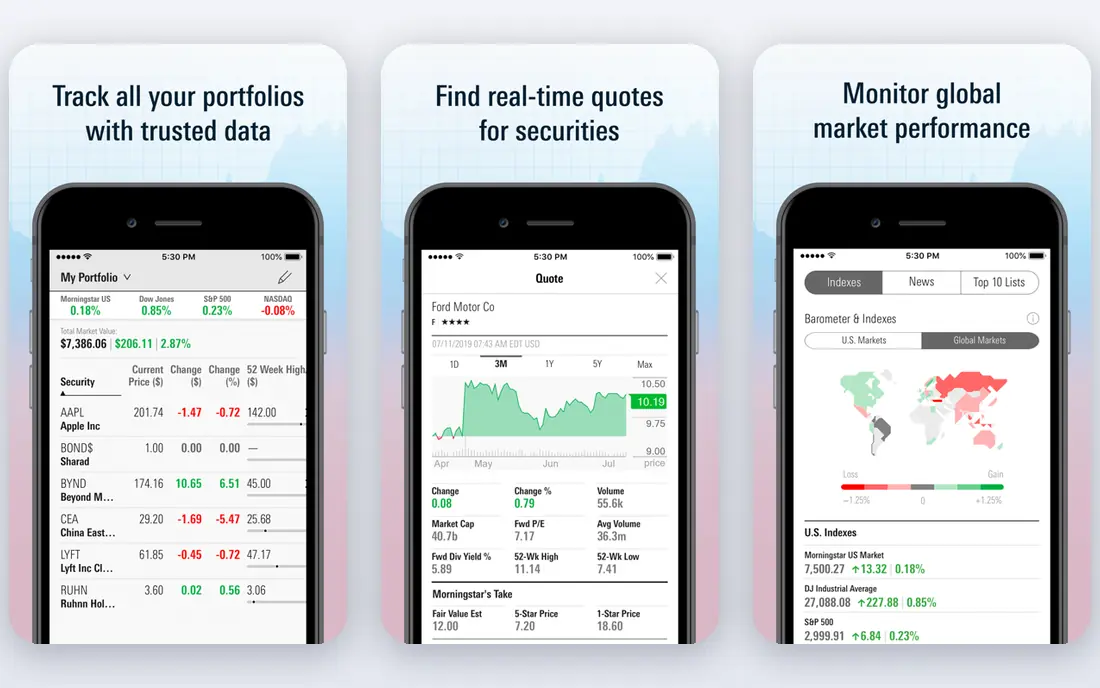
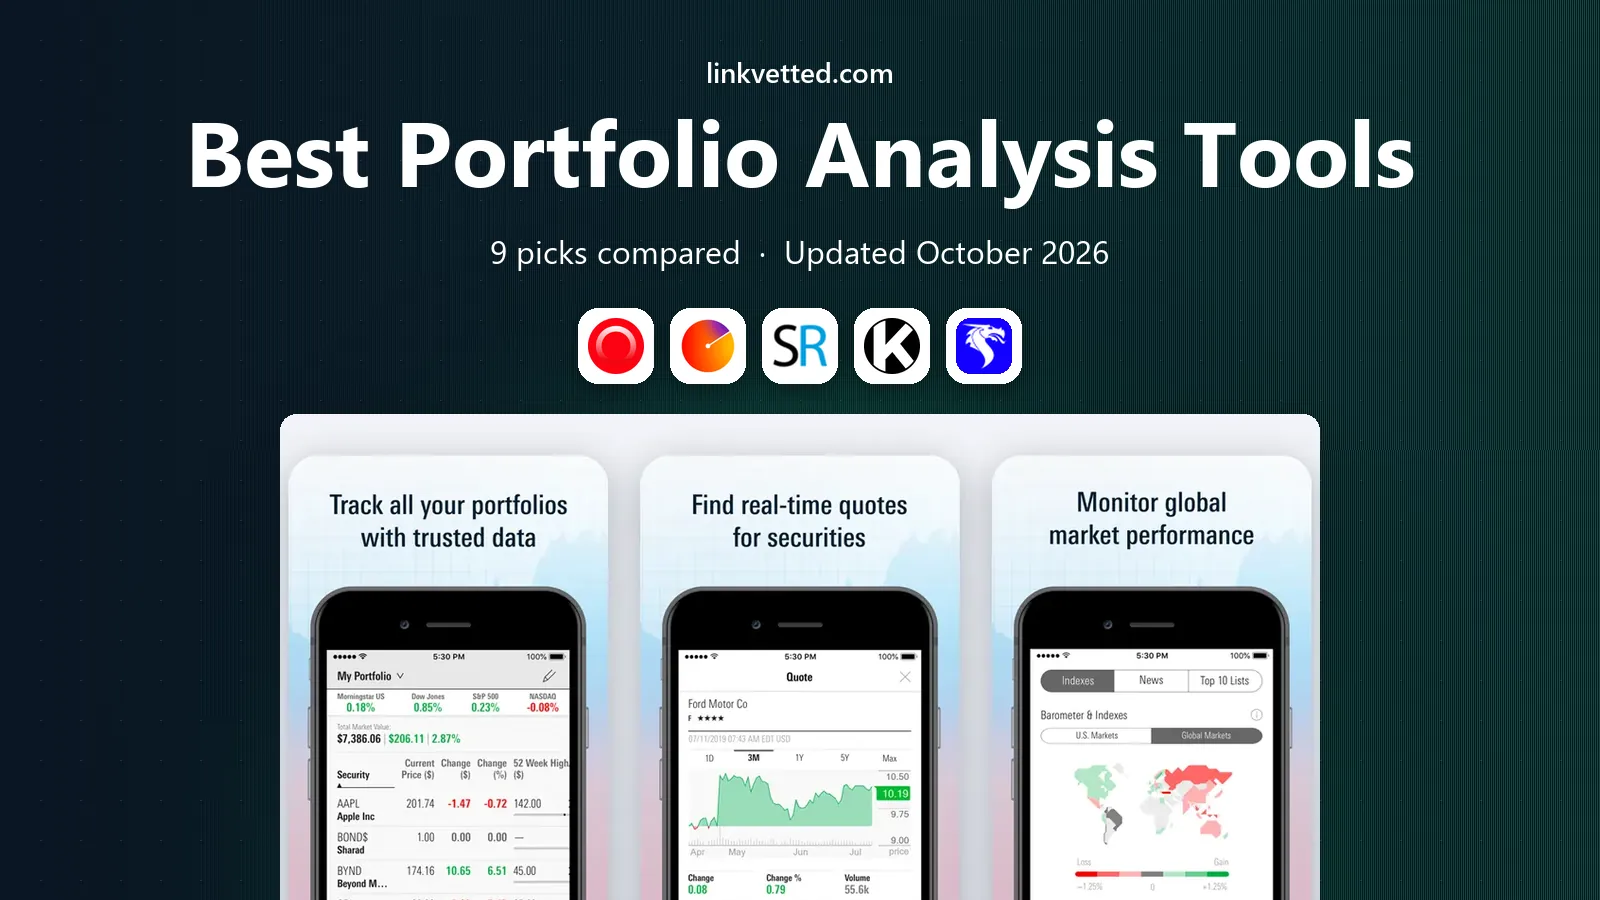
Morningstar Investor pairs portfolio tracking with research depth that few rivals match. Portfolio X-Ray breaks a portfolio into asset classes, sectors, regions, and stock overlap, and it surfaces fund fees and expenses that are easy to miss in a brokerage view. For fund investors, that single view often reveals that three different funds own much of the same stock.
The cost is the honest trade-off. At $34.95 per month, with an annual option listed at $249 per year on comparison pages, Morningstar suits investors who read fund research regularly. Casual holders who only want a balance and a return number will find cheaper tools here. If you own many funds and want to know what you truly hold, Morningstar earns its price.
- Portfolio X-Ray for allocation and fees
- Deep fund and ETF research
- Trusted ratings and reports
- Monthly price is high for casual trackers
- Best value needs the annual plan
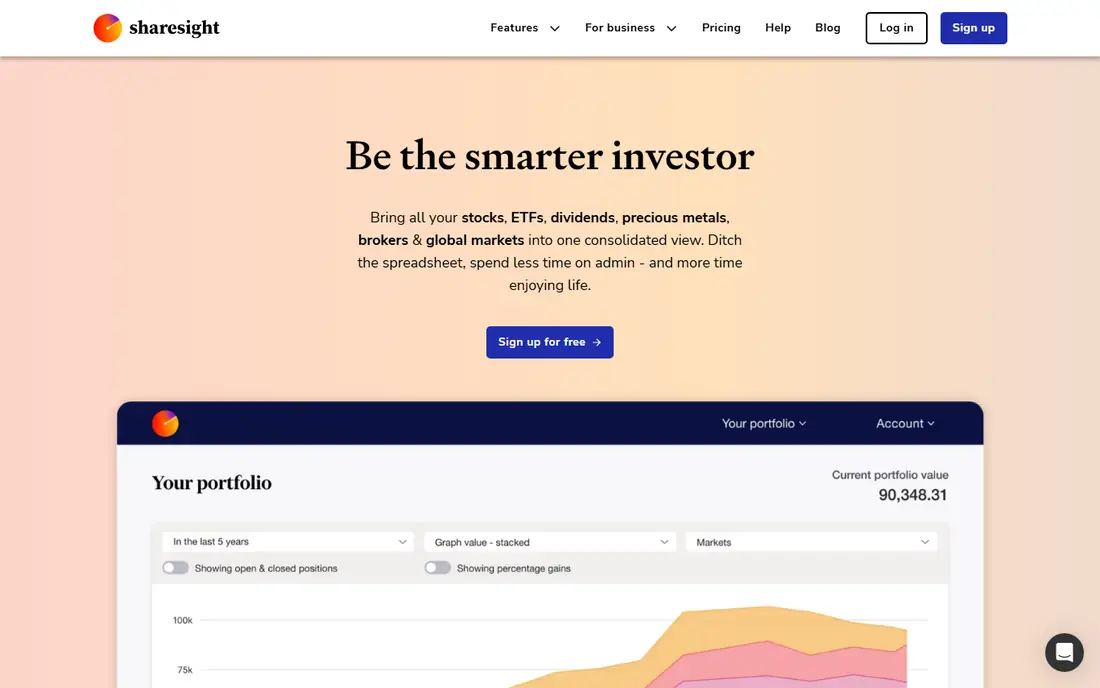
Sharesight is built around transactions, not only current prices. It records buys, sells, dividends, and distributions, then calculates true performance including income. That approach matters for dividend investors, because a price-only tracker understates the return of a high-income portfolio. Taxable income reports by period and source save real time at filing season.
The free plan covers up to 10 holdings, which suits a starter portfolio but not a diversified one. Paid annual plans start from around $84 per year on comparison pages, so confirm the current plan on the Sharesight pricing page before you buy. For investors with brokers in several countries or many dividend payers, Sharesight is our top pick in this group.
- Transaction-based performance
- Dividend and distribution tracking
- Tax reports for many countries
- Free plan caps holdings
- Full broker sync needs a paid plan

Stock Rover is the analyst workbench of this list. It combines stock and ETF screening, detailed company metrics, charting, and portfolio management, then adds reports on volatility, correlation, and future income. Active investors who compare dozens of names before buying will use more of Stock Rover in a week than a casual tracker offers in a year.
That depth comes with a learning curve. New investors may feel lost among the tables and metrics, and the free trial is the right way to test whether the workflow fits. Check the current Premium pricing on the vendor site, because plan names and prices change. If you manage a stock-heavy portfolio yourself, Stock Rover is the most complete single tool here.
- Deep screeners and charting
- Portfolio reports and rebalancing
- Dividend income projections
- Learning curve for new investors
- Premium features need a paid plan
Kubera answers a different question from the rest of this list. Instead of asking how one brokerage account is doing, it asks what your whole financial picture looks like. Stocks, bonds, crypto, bank accounts, property values, vehicles, and other holdings sit on one balance sheet, with connections to thousands of institutions. Households with assets spread across countries and account types gain the most.
Stock-only investors should look elsewhere, because Kubera at $250 per year for Essentials costs more than a focused tracker. The 14-day trial is worth using to test your exact bank and broker links before you pay. For complex households, Kubera is the clearest single view we found, and its document storage keeps valuations and statements near the numbers they support.
- Stocks, property, crypto, and other assets in one view
- Broad institution links
- Document storage
- No free plan
- Price is high for stock-only portfolios
Portfolio Visualizer is the tool for investors who want to test an idea before they trust it. You can backtest an allocation, compare it with a benchmark, run factor analysis, and model retirement withdrawals with Monte Carlo simulations. The free tools cover a large share of what a thoughtful DIY investor needs, with Basic and Pro plans for heavier modeling and saved work.
It is not a live portfolio tracker in the brokerage-sync sense. You enter holdings and allocations yourself, which suits analysis but not daily monitoring. Advanced users will love the control, while beginners may need a guide to interpret factor and drawdown results. Pair it with Sharesight or Yahoo Finance for live tracking, and use Portfolio Visualizer for the deeper what-if work.
- Backtesting and factor models
- Monte Carlo simulations
- Free core tools
- No broker sync for live tracking
- Interface suits advanced users
Seeking Alpha Premium suits investors who read research before they trade. The subscription adds analyst ratings, dividend safety grades, and quant ratings to a large library of stock and fund coverage, alongside portfolio tracking and alerts. If you already read Seeking Alpha daily, the Premium portfolio view keeps your holdings next to the research that covers them.
The trade-off is focus. Portfolio analysis here is a companion to research, not the deep tax or backtesting engine that Sharesight or Portfolio Visualizer offers. Check the current Premium price and trial terms on the vendor site, since promotions change often. For research-first investors, Seeking Alpha is a strong combined pick. For pure analysis, a specialist tool will go deeper.
- Large analyst and contributor research library
- Portfolio alerts
- Dividend grades
- Research volume can overwhelm
- Portfolio tools are secondary to articles
Yahoo Finance remains the everyday default for many investors, and for good reason. You can build portfolio lists, watch prices, read company news, and check basic performance without paying. The breadth of market coverage, from US stocks to global indices and crypto prices, makes it a useful first stop each morning.
Serious analysis needs more. Bronze and higher paid tiers add portfolio tools and research depth, and free users see ads. Treat Yahoo Finance as your monitoring dashboard and news feed, then turn to Morningstar, Sharesight, or Portfolio Visualizer when you need allocation, tax, or backtest detail. For a free starting point, it is still hard to beat.
- Free portfolio lists and watchlists
- News and quotes in one place
- Broad market coverage
- Advanced portfolio tools need a paid tier
- Ads on free plans
Ziggma gives a portfolio a score and tells you when that score moves. It checks allocation, diversification, and risk, then sends alerts when a holding or the whole portfolio drifts from a healthy shape. Investors who want a regular checkup without reading a full research report will like the plain-language summary.
Coverage is narrower than the biggest trackers, so confirm that your brokers and exchanges connect before you rely on it. A free tier lets you test the score and alerts, with paid annual plans for the full feature set. Ziggma is our pick for investors who want a simple, ongoing health check and a nudge when action is worth a closer look.
- Portfolio health score
- Smart alerts on risk and allocation
- Stock research dashboard
- Smaller broker coverage than Sharesight
- Paid plans for full features
Simply Wall St turns company analysis into visuals that are easy to read. Each stock gets a view of value, future growth, past performance, financial health, and dividends, and portfolios inherit those views across holdings. Investors who pick individual stocks will find it faster to scan a portfolio for weak names than a table of ratios alone.
Fund and bond investors gain less, because the strength lies in single-company research. A free tier covers basic use, with paid plans for full portfolio and screening features. Use Simply Wall St to judge the companies inside your portfolio, and use Morningstar or Sharesight to judge the portfolio structure and tax picture around them.
- Visual company analysis
- Quality, value, and risk snowflakes
- Portfolio linked to company views
- Stock-focused
- Weaker for fund and bond analysis
How we picked these
We compared official pricing pages, broker and exchange coverage, and feature documentation for portfolio tools that operate in October 2026. We required live or transaction-based tracking for most picks, plus a clear strength in one area: funds, dividends, stocks, balance sheet, or modeling. We left out tools that only offer managed investing, because this list is for investors who want to analyze a portfolio they control.
We did not claim hands-on trading or advisory testing. Our comparison rests on vendor feature pages, pricing pages, and public reviews. Where a price was shown only on a comparison page and not confirmed on the vendor site at writing time, we list it as See website and point you to the vendor pricing page for the current figure.
How to choose the right analysis tool
Start with the question you ask most often. Dividend investors need income and tax reports, so Sharesight leads. Fund investors need overlap and fees, so Morningstar leads. Stock pickers need screeners and company detail, so Stock Rover or Simply Wall St leads. Households with many asset types need Kubera. Testers and planners need Portfolio Visualizer.
Then check the boring details that decide daily use. Confirm your brokers connect, confirm your currencies and exchanges are covered, and confirm the free plan holds your full holding count. A tool that covers nine of your ten brokers will still leave a gap in every report. Run a one-month trial with your real portfolio before you pay for a year.
Finally, keep fees and taxes in view. A tool that shows gross returns without fund fees or tax drag flatters a portfolio. Look for net performance, fee totals, and dividend records in the same view, and review the portfolio at least quarterly. Small, regular checks beat one large annual review when markets move fast.
FAQ
What is the best portfolio analysis app for beginners?
Yahoo Finance is the simplest free starting point for monitoring prices and news. Move to Sharesight when dividends and tax reporting matter, or to Morningstar when fund research becomes the main need.
What is the best portfolio analysis software for dividends?
Sharesight is our pick for dividend tracking, because it records distributions as transactions and reports taxable income by period. Stock Rover also projects future dividend income, which helps income planners.
Can I backtest a portfolio for free?
Yes. Portfolio Visualizer offers free backtesting, factor analysis, and Monte Carlo tools with limits. Paid plans add saved models and higher limits, but the free tools cover most DIY allocation tests.
Do portfolio tools replace a financial adviser?
No. These tools show what you own and how it has performed, but they do not give personal advice. For retirement, tax, or estate decisions, speak with a licensed adviser who knows your full situation. This article is not financial advice.
How do I check fund overlap in my portfolio?
Morningstar Portfolio X-Ray is the clearest tool for overlap, showing shared holdings across funds plus sector and fee totals. Enter all fund holdings, run X-Ray, and look for the same large stocks appearing in several funds.
Is my brokerage data safe with these tools?
Reputable tools use read-only connections and encryption, and you should still check each vendor privacy policy before linking accounts. Use two-factor authentication on the tool and on your brokerage, and disconnect any tool you stop using.