Best Kubernetes Observability Tools in 2026: 10 Tools Compared
We compared the best Kubernetes observability tools for 2026, from Datadog and Grafana to Prometheus, New Relic and Honeycomb, on pricing and fit for teams.

- Editor's choice
 Datadog
Full-stack cloud-native observability
Starts at$15 per host per monthVisit datadoghq.comFull review - Great alternative
 Grafana Cloud
Managed Prometheus stack
Starts atFreeVisit grafana.comFull review - Also consider
 Prometheus
Free Kubernetes-native metrics
Starts atFreeVisit prometheus.ioFull review
TL;DR:
- Datadog is the broadest commercial option for cloud-native teams, starting at $15 per host per month for infrastructure monitoring.
- Prometheus plus Grafana remains the free, open standard for Kubernetes metrics, and Grafana Cloud removes the burden of running it yourself.
- New Relic's 100 GB per month free ingest allowance makes it the most generous free commercial tier for small clusters.
- Honeycomb and SigNoz suit OpenTelemetry-first teams that care about traces and high-cardinality data.
- Pricing models differ so much that you should compare vendors on your own metric, log and trace volumes, not on headline rates.
Quick comparison
| Tool | Best for | Starts at | Free plan? | |
|---|---|---|---|---|
| Datadog | Full-stack cloud-native observability | $15 per host per month | Free trial | Visit |
| Grafana Cloud | Managed Prometheus stack | Free | Yes | Visit |
| Prometheus | Free Kubernetes-native metrics | Free | Yes | Visit |
 New Relic | Ingest-priced full-stack monitoring | Free | Yes | Visit |
 Dynatrace | AI-driven root cause analysis | See website | Free trial | Visit |
 Splunk Observability Cloud | Enterprise-scale observability | $15 per host per month | Free trial | Visit |
 Honeycomb | Trace-led debugging | Free | Yes | Visit |
 SigNoz | OpenTelemetry-native observability | Free | Yes | Visit |
 Elastic Observability | Log-led observability | See website | Free trial | Visit |
 Sysdig | Container security plus monitoring | See website | Free trial | Visit |
The best Kubernetes observability tools
Kubernetes observability means knowing what your clusters, pods and services are doing, through metrics, logs and traces, before your users tell you something is broken. We compared official pricing pages, feature documentation and public reviews to pick ten tools that cover open source stacks, managed services and enterprise platforms, all actively maintained in October 2026.

Datadog is the default commercial observability platform for cloud-native teams, and its Kubernetes support is the most complete here. The agent discovers pods, services and clusters automatically, and infrastructure monitoring starts at $15 per host per month, with APM, log management and other products billed as add-ons. One platform covering infrastructure, application performance, logs, synthetics and security is a real advantage for teams that want a single view.
The catch is the bill. Log ingestion, custom metrics and APM hosts each add charges, and costs can balloon as clusters grow, especially with high metric cardinality. Datadog suits teams with budget for a full platform and the discipline to manage what they ingest. Smaller teams should start with its trial and watch the first invoice closely.
- Broadest integration coverage for Kubernetes
- Metrics, logs, traces and security in one platform
- Strong Kubernetes autodiscovery
- Costs stack up fast across add-ons
- Custom metrics and log volume can surprise teams
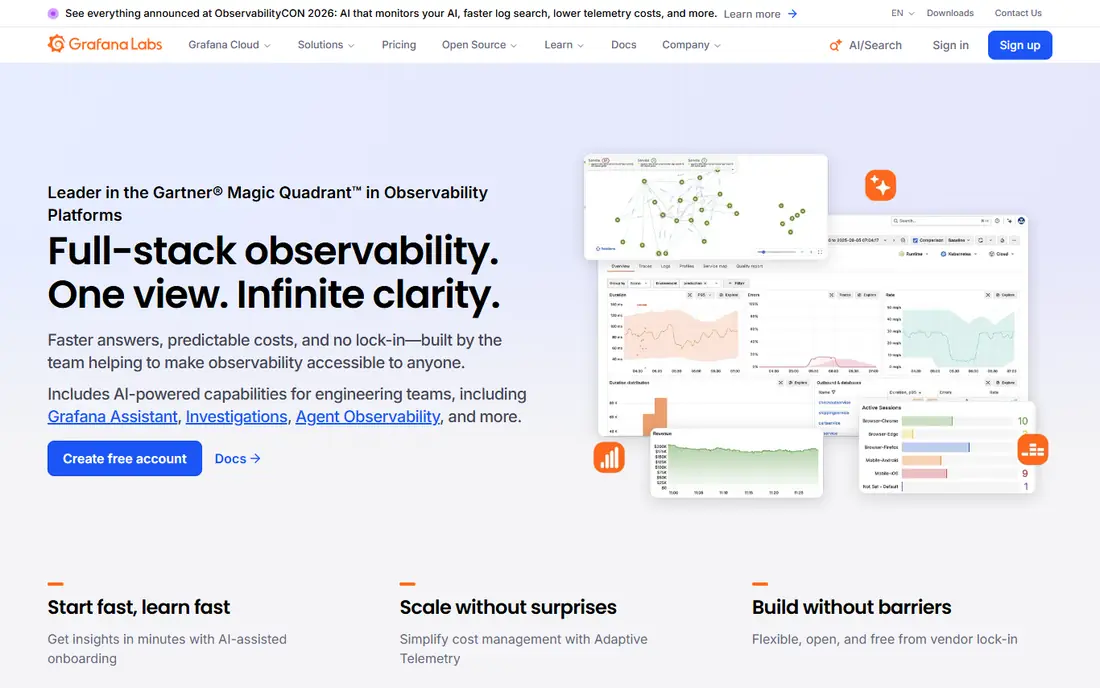
Grafana Cloud takes the open source observability stack and runs it for you. It offers managed metrics through Prometheus-compatible storage, logs through Loki and traces through Tempo, plus dashboards and alerting in one place. The free tier includes 10,000 active series, 50 GB of logs, 50 GB of traces and 3 users, which covers small clusters comfortably, and paid plans start at $8 per user per month after that.
Because it speaks Prometheus and OpenTelemetry, Grafana Cloud works with any Kubernetes distribution and avoids locking you into a proprietary agent. The downside is that building good dashboards and alerts still takes Grafana knowledge, and per-user charges add up for large teams. For platform teams that want the open stack without operating it, Grafana Cloud is our pick.
- Managed Prometheus, Loki and Tempo without self-hosting
- Generous free tier
- Works with any Kubernetes distribution
- Per-user pricing after the free tier
- Query and dashboard complexity for beginners

Prometheus is the metrics engine behind most Kubernetes monitoring, and it remains free open source software. It discovers Kubernetes services and pods automatically, scrapes metrics on a schedule, and pairs with PromQL, a powerful query language, plus Alertmanager for notifications. The exporter ecosystem covers nodes, databases, message queues and nearly every infrastructure component you run.
What Prometheus does not do is logs or distributed tracing, so teams pair it with Grafana for dashboards and Loki or another tool for logs. Operating it at scale also takes work: storage, retention, high availability and long-term queries all fall to your team. For teams with platform skills who want full control at zero license cost, Prometheus is still the foundation to build on.
- Free and open source
- Kubernetes-native service discovery
- Huge exporter ecosystem
- You operate storage, scaling and retention yourself
- No built-in logs or traces
New Relic rebuilt its pricing around data ingest rather than per-host fees, which changes the math for Kubernetes teams. The free tier includes 100 GB of ingest per month and one full-platform user, with additional data billed around $0.35 to $0.40 per GB. That model suits clusters with modest log volume but many nodes, since you do not pay per host.
The risk is the opposite shape: chatty applications that log heavily can push ingest costs up fast, so data discipline matters. Paid full-platform users are also pricey, which affects large teams. For small to mid-size clusters that want a full commercial platform with a genuinely usable free tier, New Relic is the best place to start.
- 100 GB per month of ingest free plus one full-platform user
- Single platform for infra, APM, logs and browser
- No per-host charges
- Ingest-based pricing punishes noisy log volume
- Additional full users are expensive
Dynatrace is the enterprise choice for teams that want observability to point at the cause, not just show symptoms. Its OneAgent auto-discovers Kubernetes clusters, pods, services and dependencies, builds a live topology map, and uses its Davis AI engine to trace problems to a root cause. Infrastructure monitoring is listed around $29 per host per month, with full-stack monitoring around $58 per 8 GiB host, under a consumption-based platform subscription.
Pricing is complex and quote-based, which makes budgeting harder than a simple per-host rate. Dynatrace suits large enterprises with critical workloads where faster root cause analysis justifies the cost. Smaller teams will usually get better value from Grafana Cloud or New Relic's free tier.
- Automatic topology mapping across Kubernetes
- AI-driven root cause analysis
- Managed or SaaS deployment
- Quote-based consumption pricing
- Infrastructure monitoring starts around $29 per host per month
Splunk Observability Cloud, now part of Cisco, brings Splunk's large-scale data engine to Kubernetes monitoring, with infrastructure monitoring from $15 per host per month and APM options above that. It handles metrics, traces and logs with real-time streaming analytics, and it suits organizations that already use Splunk for security or log analysis and want one vendor across both.
The platform is built for scale, which means small clusters may find it more complex and expensive than needed. A 14-day trial lets you test it against your real workloads. For enterprises standardizing on Splunk, or teams with very large telemetry volumes, it is a strong contender.
- Strong metrics, traces and log analysis at scale
- Good for organizations already using Splunk
- Real-time streaming analytics
- Pricing rises with hosts and capabilities
- Can feel heavy for small clusters
Honeycomb takes a different approach from metrics-first tools: it centers on wide events and traces, letting engineers ask detailed questions about specific requests, users or edge cases without pre-aggregating data away. That makes it excellent for debugging production issues in microservices running on Kubernetes, where the question is often why one request failed rather than what the average latency was. There are no per-seat charges and no cardinality charges.
Teams used to Prometheus dashboards may find the event-based model unfamiliar, and Honeycomb is weaker as a simple infrastructure metrics dashboard. Pair it with Prometheus or Grafana Cloud for host metrics, and use Honeycomb where debugging speed matters most. For microservices teams, it is one of the most loved tools in this list.
- Built for high-cardinality tracing and fast debugging
- No per-seat charges
- Generous free tier
- Less of a traditional metrics dashboard tool
- Event-based model takes adjustment for Prometheus teams
SigNoz is an open source observability platform built natively on OpenTelemetry, covering metrics, traces and logs in a single tool. The self-hosted edition is free, which appeals to teams that want to avoid per-host and per-GB pricing, and its cloud offering bills by usage. Because it is OpenTelemetry-native, instrumenting Kubernetes workloads with standard SDKs and collectors works cleanly.
SigNoz is younger than Datadog, Grafana or New Relic, so its ecosystem and enterprise features are thinner, and self-hosting means you own upgrades and scaling. For OpenTelemetry-first teams that want a single open source backend for all three signals, SigNoz is the most promising option and a genuine Datadog alternative at small and mid-size scale.
- Free self-hosted edition
- Built natively on OpenTelemetry
- Metrics, traces and logs in one tool
- Younger project than Datadog or Grafana
- Self-hosting needs operational effort
Elastic Observability builds on Elasticsearch, which remains one of the best engines for searching and analyzing logs at scale. The platform adds metrics, traces, APM and Kubernetes dashboards on top, so teams that already centralize logs in Elastic can extend the same stack to full observability. A self-hosted open source option exists, and Elastic Cloud offers a 14-day trial.
Cloud pricing is based on deployment resources rather than a simple per-host rate, which makes cost comparisons harder. Operating Elasticsearch at scale also takes expertise. Elastic fits organizations already invested in the Elastic Stack, or teams where log analysis is the primary observability job and metrics and traces are secondary.
- Excellent log search and analysis
- Metrics and traces alongside logs
- Self-hosted open source option
- Cloud pricing is resource-based and harder to predict
- Can be heavy to operate at scale
Sysdig stands out by combining Kubernetes monitoring with container security, runtime threat detection and compliance in one agent. It gives deep visibility into container activity, system calls and network behavior, which helps security-conscious teams detect threats and prove compliance alongside performance monitoring. That dual role suits regulated industries and enterprises with strict security requirements.
Pricing is quote-based, and the security depth adds complexity if you only want metrics and dashboards. A free trial lets you evaluate both sides. For teams that would otherwise buy separate monitoring and container security tools, Sysdig can simplify the stack and the vendor list.
- Combines Kubernetes monitoring with container security and compliance
- Deep runtime visibility
- Good for regulated environments
- Quote-based pricing
- Security focus adds complexity for pure monitoring buyers
How we picked these
We compared official pricing pages, product documentation and public reviews, and we only included tools with real Kubernetes support that are actively maintained in October 2026. We mixed open source stacks, managed services and enterprise platforms, and we covered metrics, logs and traces rather than single-signal tools. Pricing figures are directional, since Kubernetes monitoring bills depend heavily on metric cardinality, log volume and retention.
How to choose the right observability tool
Start by standardizing on OpenTelemetry for instrumentation, regardless of which backend you pick. OpenTelemetry lets you send metrics, logs and traces to different vendors without re-instrumenting your applications, which protects you if pricing or needs change. Then choose a backend based on your team's size and budget rather than feature lists alone.
Next, model your real costs before committing. Count your hosts, estimate monthly log and trace volume, and check metric cardinality from labels like pod names and user IDs. A tool that looks cheap per host can become expensive on ingest, and vice versa. Run a trial on a production-like cluster, not a demo app, and compare the first invoice against your estimate.
Match the tool to the debugging job
Metrics tools like Prometheus and Grafana Cloud answer how the system behaves overall. Trace-led tools like Honeycomb answer why a specific request failed. Log-led tools like Elastic answer what happened in detail. Most teams need metrics plus one of the other two. Buying all three as separate enterprise products is rarely necessary for small and mid-size clusters.
Control cardinality and log volume early
The biggest observability bills come from high-cardinality labels and chatty logs, not from the base license. Drop labels you do not query, sample verbose logs, and set retention to match how far back you actually investigate. Review ingest monthly and treat a rising bill as a signal to tune instrumentation, not just to pay more.
FAQ
What is Kubernetes observability?
It is the practice of understanding Kubernetes clusters through three signals: metrics that show resource use and performance, logs that record events, and traces that follow requests across services. Together they let teams detect problems, find root causes and confirm fixes. Without observability, a Kubernetes cluster is a black box that only reveals problems through user complaints.
Do I need a paid tool, or is Prometheus enough?
Prometheus plus Grafana covers metrics and dashboards for free and suits many teams, especially with platform skills in house. Paid tools add managed operations, logs, traces, alerting depth and support. Start with Prometheus and Grafana Cloud's free tier, and move to a paid platform when operating the stack or missing signals costs more time than the license.
How much does Kubernetes observability cost?
It varies widely. Open source tools are free apart from hosting and your time. Grafana Cloud and New Relic offer free tiers for small clusters, Datadog infrastructure monitoring starts at $15 per host per month, and enterprise platforms like Dynatrace run higher under consumption pricing. Model your hosts, log volume and metric cardinality before comparing headline rates.
What is OpenTelemetry and why does it matter?
OpenTelemetry is an open standard for collecting metrics, logs and traces from applications, with SDKs and collectors that work across vendors. Standardizing on it means you can switch observability backends without rewriting instrumentation. Most tools on this list support it natively, and it is the safest long-term choice for Kubernetes teams.
How do I keep observability costs down?
Limit metric cardinality by avoiding high-cardinality labels, sample or drop verbose logs, set retention to what you actually use, and review ingest monthly. Use free tiers and open source tools for non-production clusters, and reserve paid enterprise features for production. Cost discipline in instrumentation matters more than picking the cheapest vendor.
Can one tool cover metrics, logs and traces?
Yes. Datadog, New Relic, Dynatrace, Splunk, SigNoz and Elastic all cover all three signals in one platform. Open source teams usually combine Prometheus for metrics, Loki or Elastic for logs, and Tempo or Jaeger for traces under Grafana. A single platform is simpler, while a combined open stack is cheaper and more flexible.