Best Data Visualization Tools in 2026: 9 Platforms Compared
Compare the best data visualization tools in 2026, from Tableau and Power BI to free Looker Studio and Metabase, with pricing and use cases for teams compared.
- Editor's choice
 Tableau
Deep custom dashboards and analysis
Starts at$75 per monthVisit tableau.comFull review - Great alternative
 Microsoft Power BI
Microsoft ecosystem reporting
Starts at$14 per monthVisit microsoft.comFull review - Also consider
 Looker Studio
Free Google marketing dashboards
Starts atFreeVisit lookerstudio.google.comFull review
TL;DR:
- Tableau suits deep, custom visual work, while Power BI suits Microsoft focused teams that want strong value per seat.
- Looker Studio is the easiest free start for marketing reports, especially when data already lives in Google tools.
- Metabase and Grafana give smaller teams and technical teams a lower cost path, with different strengths in self-service and live monitoring.
- Governance, data modelling, and viewer pricing often matter more than chart styles, so check those before choosing.
Quick comparison
| Tool | Best for | Starts at | Free plan? | |
|---|---|---|---|---|
| Tableau | Deep custom dashboards and analysis | $75 per month | Free trial | Visit |
| Microsoft Power BI | Microsoft ecosystem reporting | $14 per month | Yes | Visit |
| Looker Studio | Free Google marketing dashboards | Free | Yes | Visit |
 Qlik Sense | Associative exploration across data | See website | Free trial | Visit |
 Metabase | Simple self-service team dashboards | See website | Yes | Visit |
 Datawrapper | Clean publishable charts and maps | See website | Yes | Visit |
 Flourish | Animated interactive stories | See website | Yes | Visit |
 Grafana | Live monitoring and time series charts | See website | Yes | Visit |
 Zoho Analytics | Small business drag-and-drop reporting | See website | Free trial | Visit |
The best data visualization tools
We compared official feature pages, pricing pages, documentation, and public reviews to weigh chart depth, data connections, sharing, and total cost.
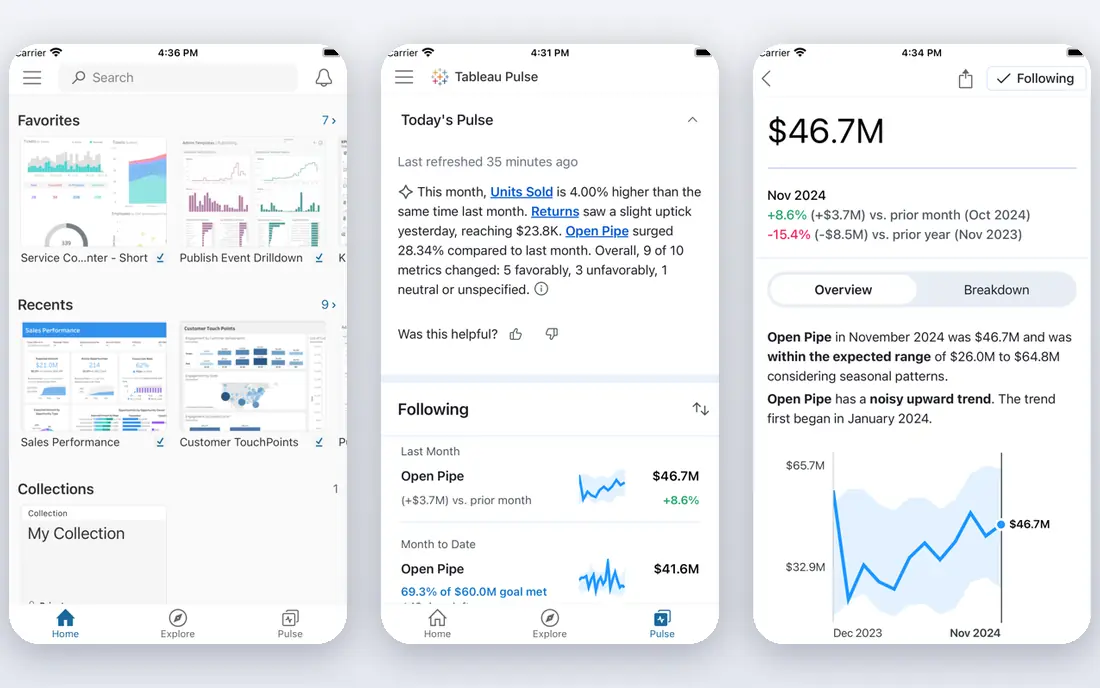
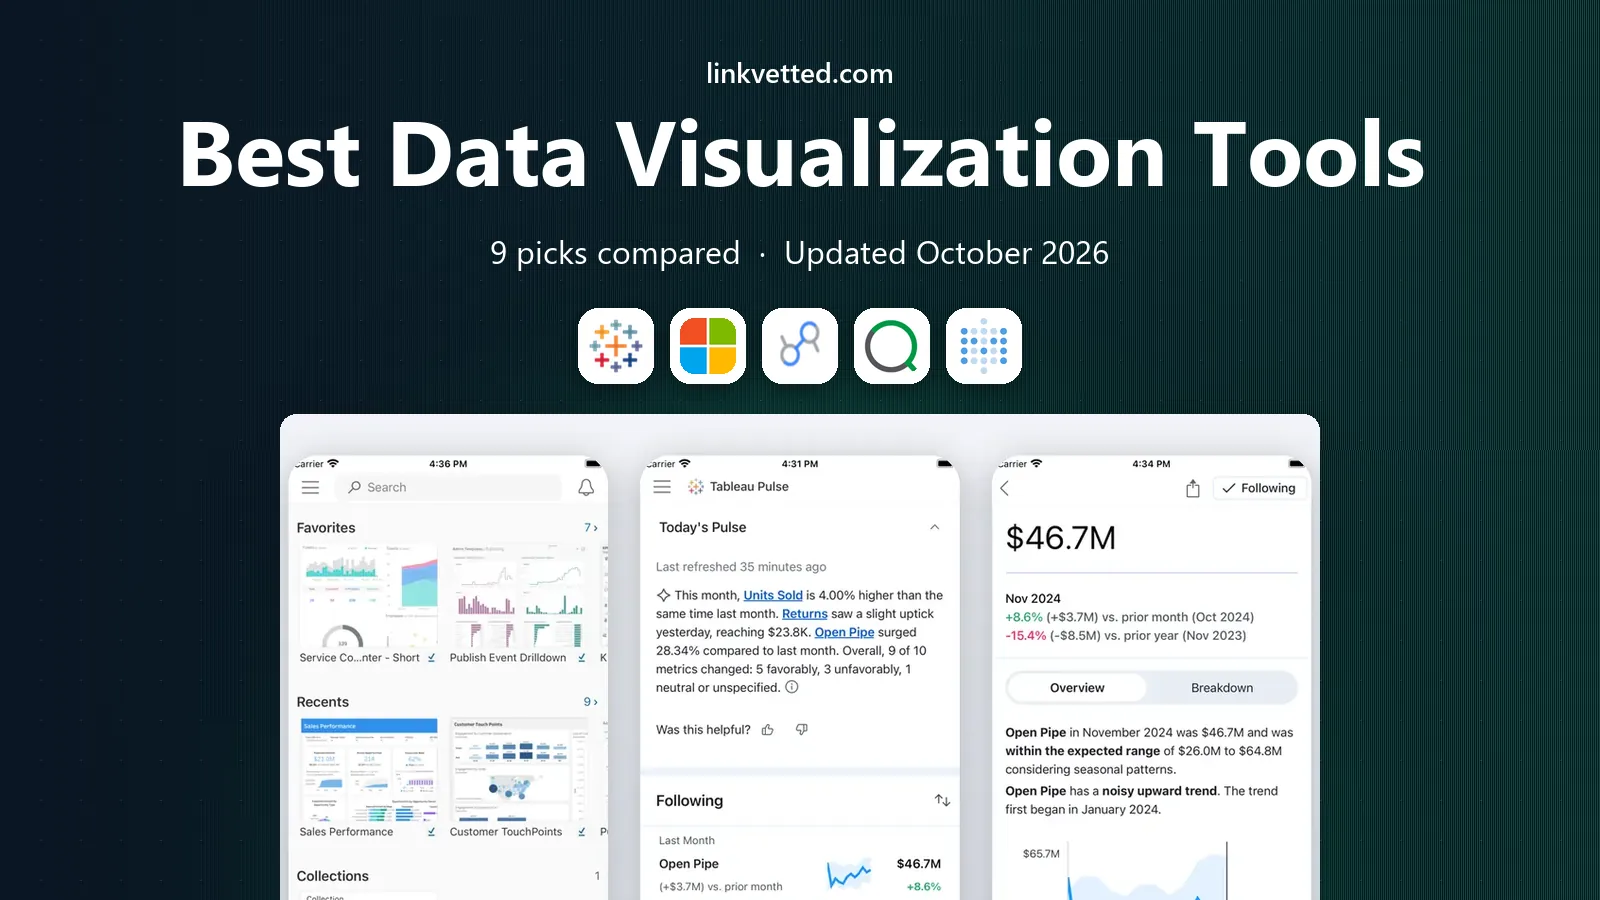
Tableau remains the reference point for visual depth. Analysts can build detailed dashboards with filters, parameters, calculations, and geographic views, then let viewers explore rather than read a static report. That flexibility helps when questions change during a meeting and the data needs to answer back quickly. Cost and skill are the trade-offs. A Creator licence at the price shown above is a serious commitment, and teams without an analyst may not use the depth they pay for. For organisations with complex data and dedicated analysts, though, the range of visuals and the control over design still justify the spend.
- Wide chart types and strong interactive dashboards
- Handles large and varied data sources
- Large community and learning resources
- Higher price than many rivals
- Learning curve is steep for new analysts
Power BI is the natural pick for teams already running on Microsoft 365. Reports built in the free desktop app can draw on Excel and other Microsoft sources, and publishing to the service makes sharing inside a company straightforward. The modelling tools also go further than a simple chart builder when data needs cleaning and combining. The catch is licence structure. Building a report is free, but sharing it widely needs paid licences or capacity, so viewer costs can grow with the audience. Teams should map builders and viewers separately before estimating the total, rather than counting only the analysts.
- Strong integration with Excel, Teams, and Azure
- Data modelling with Power Query and DAX
- Free desktop app for building reports
- Sharing and collaboration need a paid licence
- Some advanced modelling takes time to learn
Looker Studio is the fastest free route to a marketing dashboard. If traffic, ad spend, and spreadsheet data already sit in Google tools, a readable report can be built in an afternoon and shared with a link. For agencies and small marketing teams, that low friction often matters more than advanced analytics. Limits appear when data lives outside Google, or when a team needs strict permissions, version control, or complex models. Paid partner connectors can fill some gaps, but costs add up. Use Looker Studio where Google data dominates, and a stronger BI platform where governance is central.
- Free for creators and viewers in the standard version
- Native connectors for Analytics, Ads, Sheets, and BigQuery
- Easy sharing by link
- Weaker for non-Google data without paid connectors
- Governance and advanced modelling are limited
Qlik Sense takes a different approach to exploration. Instead of following one fixed drill path, users can click a value and see related and unrelated data highlighted at once, which can reveal links that a standard filter might hide. That model suits analysts who explore open questions rather than repeat a fixed monthly report. The price and setup are the hurdles. Smaller teams may find the sales process and learning curve heavy for simple reporting. Larger teams with varied data and curious analysts, though, often value the exploration model once the data model is built well.
- Associative engine surfaces links across fields
- Strong interactive exploration without fixed query paths
- Good for large, varied datasets
- Pricing is quote based for many teams
- Setup and modelling need more skill than simple dashboard tools
Metabase suits startups and small teams that want dashboards without hiring a BI specialist. Staff can ask a question in plain steps, save it as a chart, and pin it to a dashboard, which keeps reporting close to the people who use the numbers. The open source version also lowers the barrier to trying it. As needs grow, limits show. Complex modelling, strict permissions, and highly polished public visuals are stronger elsewhere. Still, for internal team dashboards and fast answers, Metabase gives a lot of value for a modest cost and effort.
- Open source option with a friendly question builder
- Non-technical users can ask questions without SQL
- Dashboards and alerts cover daily team needs
- Visual polish and advanced modelling trail enterprise BI tools
- Larger deployments need paid plans and care with governance
Datawrapper is built for publishers, journalists, and communicators rather than BI teams. A dataset pasted or uploaded becomes a clean chart or map with sensible defaults, and the embed can sit inside an article without extra design work. That focus keeps the workflow short for public-facing visuals. Business users should not expect a full dashboard platform. It does not replace Tableau or Power BI for internal modelling, alerts, or governed metrics. For a team that needs one excellent chart for a report or a web page, though, Datawrapper is often faster and neater than a heavy BI tool.
- Charts and maps look clean for publication
- No code needed for most chart types
- Embeds work well in articles and reports
- Not a full BI platform for live business dashboards
- Advanced data modelling is outside its scope
Flourish helps when a chart needs to tell a story over time. Animated bars, maps, and interactive templates can show change in a way that a static chart cannot, which suits newsrooms, agencies, and public reports. Templates also help non-designers produce a polished result quickly. The free tier trade-off is visibility, since free projects are public, so internal or sensitive data should not go there. Flourish also lacks the modelling and permissions of a BI platform. Treat it as a storytelling layer for published work, not as the system of record for company metrics.
- Animated and interactive templates for storytelling
- No code needed for most visual stories
- Embeds suit web pages and presentations
- Free projects are public in the free tier
- Not designed for governed internal BI reporting
Grafana is the pick for teams watching systems, metrics, and live data. Engineers can build dashboards from time series sources, set alerts, and track performance in near real time. That focus makes it a standard choice for operations, infrastructure, and product analytics teams. Business reporting teams may find it less friendly. It rewards technical users who understand their data sources, and executive storytelling often needs extra design work. For monitoring and operational visibility, though, few tools match its combination of flexibility, alerts, and open source access.
- Strong time series and live monitoring dashboards
- Open source roots with wide data source support
- Alerts help teams react to changes
- Setup and dashboard design need technical skill
- Less suited to polished marketing or executive storytelling
Zoho Analytics suits small businesses that want business reporting without a BI project. Dashboards can be built by dragging fields, and built-in forecasting, alerts, and scheduled reports cover many routine needs. Teams already using Zoho apps get extra benefit from native connections. Larger or more analytical teams may hit limits in modelling depth and custom visuals. The tool is best judged as a practical small business reporter, not as an enterprise analytics platform. For that audience, the balance of ease, features, and price is attractive.
- Drag-and-drop dashboards with forecasting and alerts
- Connectors for Zoho apps and common business tools
- Good value for small teams
- Less depth than Tableau or Power BI for complex analysis
- Best value is strongest inside the Zoho ecosystem
How we picked these
We compared official feature pages, pricing pages, and documentation, plus app listings and public reviews, with attention to chart range, data connections, sharing, governance, and total cost for builders and viewers. We favoured tools with a clear audience, rather than tools that claim to serve every use case equally well. Where pricing varied by edition, region, or capacity, we used See website instead of guessing a single figure. We did not claim hands-on testing for every platform, and enterprise pricing changes often, so teams should confirm current licence terms and viewer costs with the vendor before signing. A short trial with real data, including a dashboard shared with the intended viewers, usually reveals more than a demo with sample data.
How to choose the right tool
Start with the data you already have
List the main sources first, whether they are Google, Microsoft, databases, or spreadsheets. A tool with native connectors for those sources will save weeks of manual exports. If a connector needs a paid partner service, add that cost to the licence price.
Count viewers, not just builders
Many BI costs grow with viewers, not with analysts. A tool that looks cheap for two builders can become costly for 100 viewers. Map who needs to view, edit, and govern data, then ask for a quote on that full audience.
Test governance early
Check permissions, data definitions, and version control before dashboards multiply. A tool that lets every team define the same metric differently will create confusion later, even if the charts look good at first.
Match polish to the audience
Internal operations dashboards need clarity and alerts, while published charts need design polish. A monitoring tool and a storytelling tool can sit side by side, and choosing one tool for both jobs often means a compromise on one side.
FAQ
What is the best data visualization tool for marketing?
Looker Studio is the best starting point for many marketing teams because it is free and connects directly to Google Analytics, Google Ads, and Sheets. Datawrapper and Flourish are better for a single publishable chart or an animated story. For governed marketing reporting across many sources, Power BI or Tableau may suit larger teams better.
Which data visualization platform is the best overall?
There is no single best platform for every team. Tableau leads on visual depth, Power BI leads on value inside Microsoft environments, and Looker Studio leads on free access for Google data. The best overall pick for a given team depends on data sources, viewer count, governance needs, and analyst skill.
What is the best data visualization software for small businesses?
Metabase and Zoho Analytics are strong small business picks because they keep setup and cost lower than enterprise BI tools. Looker Studio is also a good free option when data already lives in Google tools. Small teams should start with one clear dashboard, then expand only when the first one is used regularly.
What is the best tool for visual analytics?
Qlik Sense suits open exploration because its associative engine highlights links across fields, while Tableau suits deep interactive analysis with custom calculations. Grafana suits live operational analytics, where time series data and alerts matter more than presentation polish. Match the tool to the kind of question being asked.
Is free data visualization software good enough?
Free tools can be enough for many teams. Looker Studio covers marketing reporting, Metabase covers internal self-service, and Grafana covers monitoring. Free tiers often limit governance, support, or private sharing, so check those limits before using a free tool for sensitive or company-wide reporting.
Do I need coding skills to use these tools?
Most tools in this list do not need coding for basic dashboards, including Looker Studio, Metabase, Zoho Analytics, Datawrapper, and Flourish. Advanced modelling in Power BI with DAX, or custom work in Tableau, does need more skill. Teams without analysts should favour tools with a visual question builder and clear templates.