Best Data Visualization Platform for Analytics in 2026: 10 Platforms Compared
We compared the best data visualization platform for analytics in 2026, from Tableau and Power BI to Looker, Qlik and Metabase, on price and fit for teams.
- Editor's choice
 Tableau
Visual exploration and dashboards
Starts at$15 per user per monthVisit tableau.comFull review - Great alternative
 Microsoft Power BI
Microsoft ecosystem analytics
Starts at$14 per user per monthVisit powerbi.microsoft.comFull review - Also consider
 Looker
Governed data modeling
Starts atSee websiteVisit cloud.google.comFull review
TL;DR:
- Microsoft Power BI is the best value for most teams, with Pro at $14 per user per month and deep Microsoft 365 integration.
- Tableau remains the strongest pure visualization tool, with Viewer from $15 per user per month and Creator at $75.
- Looker and Qlik Sense suit data teams that need governed, modeled data rather than free-form dashboards.
- Metabase and Apache Superset give small teams real dashboards for free through self-hosting.
- Looker Studio is free and is the easiest way to build shareable dashboards on Google data.
Quick comparison
| Tool | Best for | Starts at | Free plan? | |
|---|---|---|---|---|
| Tableau | Visual exploration and dashboards | $15 per user per month | Free trial | Visit |
| Microsoft Power BI | Microsoft ecosystem analytics | $14 per user per month | Yes | Visit |
| Looker | Governed data modeling | See website | No | Visit |
 Qlik Sense | Associative data exploration | $30 per user per month | Free trial | Visit |
 Sisense | Embedded analytics | See website | No | Visit |
 Domo | Executive dashboards | See website | No | Visit |
 Metabase | Easy self-hosted dashboards | Free | Yes | Visit |
 Apache Superset | Free open source BI | Free | Yes | Visit |
 Looker Studio | Free Google dashboards | Free | Yes | Visit |
 ThoughtSpot | Search-driven analytics | See website | Free trial | Visit |
The best data visualization platform for analytics
A data visualization platform turns raw numbers into charts, dashboards and reports that people can actually act on. We compared official pricing pages, feature documentation and public reviews to pick ten platforms that cover enterprise BI, self-service dashboards, embedded analytics and free open source options, all available in October 2026.
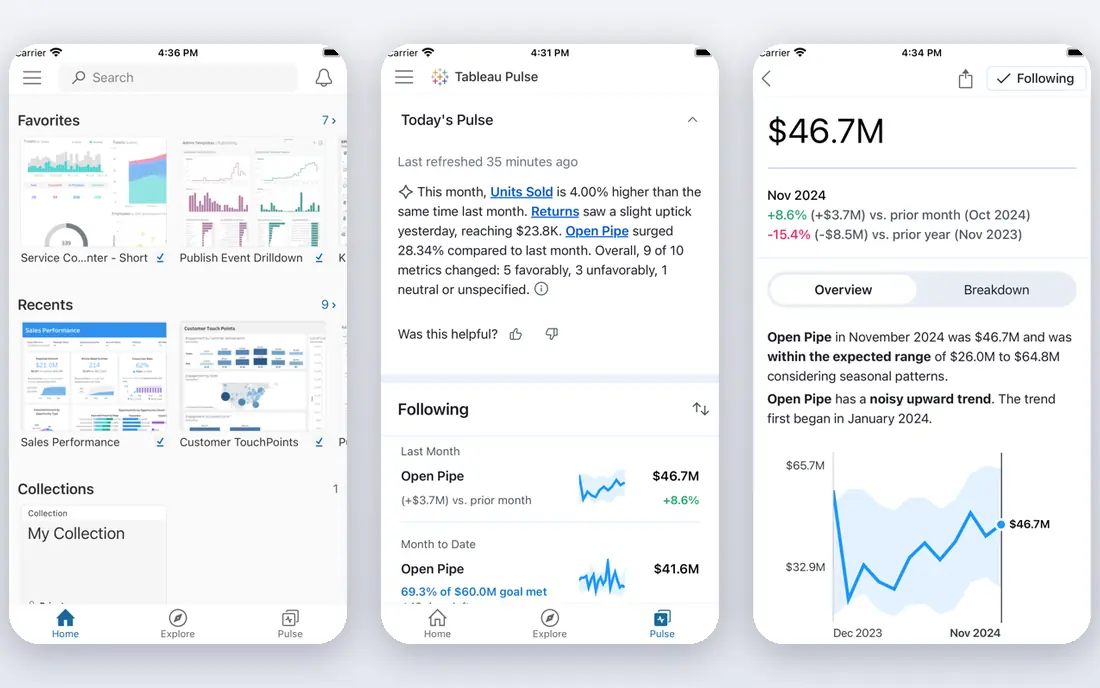
Tableau, now part of Salesforce, remains the benchmark for visual analytics. Its drag-and-drop interface lets analysts explore data, build interactive dashboards and tell stories with charts without writing code, and its community, training and template library are the largest in the category. Pricing runs from $15 per user per month for Viewer, $42 for Explorer and $75 for Creator, with server and enterprise options above that.
The cost is the catch, especially Creator licenses for everyone who builds content. Tableau also rewards training: casual users get value fast, but advanced calculations and large datasets take skill. For teams where visual exploration quality matters most and the budget allows it, Tableau is still the tool other platforms are measured against.
- Best-in-class visual exploration
- Drag-and-drop analytics
- Large community and learning resources
- Creator at $75 per user per month is expensive
- Large datasets and advanced use need training
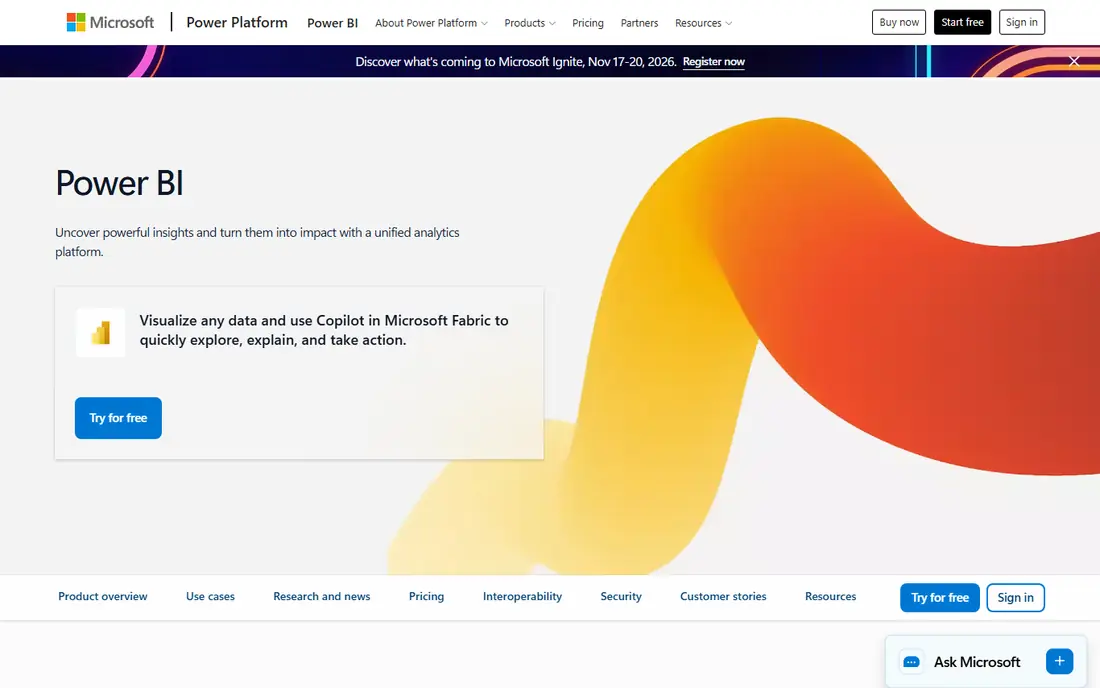
Microsoft Power BI is the best value BI platform for most organizations, and the market leader by deployments. Power BI Desktop is free for building reports, Pro costs $14 per user per month for sharing and collaboration, and Premium per user runs $24, with capacity-based Fabric options for larger deployments. Native integration with Excel, Teams, SharePoint, Azure and Dynamics 365 makes it the natural choice for Microsoft shops.
The trade-off is ecosystem fit: teams outside Microsoft 365 get less of the magic, and advanced data modeling with DAX takes real learning. Power BI's visualization gap with Tableau has also narrowed considerably. For any organization already paying for Microsoft 365, Power BI is the obvious starting point, and its price is hard for rivals to match.
- Pro at $14 per user per month
- Free Desktop app
- Native Excel, Teams and Azure integration
- Best experience requires Microsoft 365
- Advanced modeling with DAX takes learning
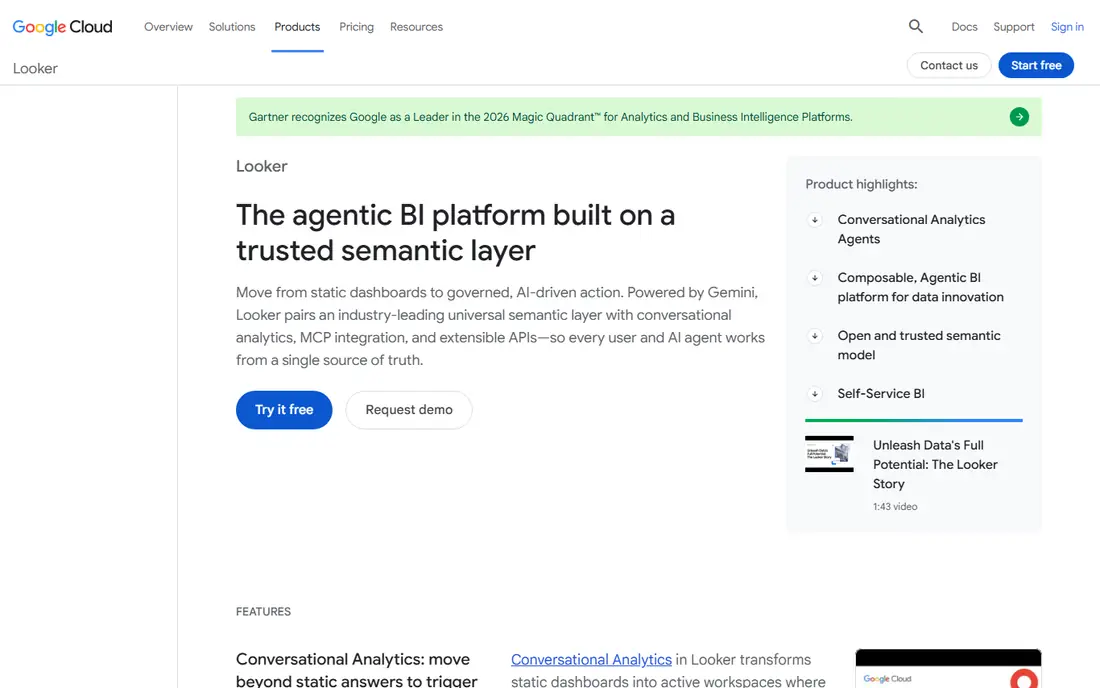
Looker, part of Google Cloud, is built around LookML, a modeling language that defines metrics once so every dashboard and report agrees on what revenue or churn means. That governed approach suits data teams at companies where inconsistent numbers cause arguments, and its BigQuery integration makes it natural for Google Cloud shops. Embedded analytics and custom data applications are also strengths.
Pricing is custom and enterprise-level, with quoted deals often starting in the tens of thousands a year, and LookML requires developers to build and maintain models. Business users cannot just drag any field onto a chart the way they can in Tableau or Power BI. For organizations that prize consistent, governed metrics above free-form exploration, Looker is worth the investment.
- LookML gives one governed definition of every metric
- Strong BigQuery integration
- Good for embedded analytics
- Custom enterprise pricing
- Requires LookML developers
- Self-service is limited for business users
Qlik Sense uses an associative data engine that shows how selections relate across all your data, highlighting associated and unrelated values as you click. That free-form exploration helps analysts spot patterns they were not looking for, and its Insight Advisor adds AI-generated charts and explanations. Pricing starts at $30 per user per month billed annually, with premium tiers quoted, and it runs in the cloud or on premises.
The price is higher than Power BI's entry point, and enterprise pricing can get complex. The learning curve for advanced use is also real. For mid-size and large teams that value flexible exploration and governed self-service over the cheapest seat, Qlik Sense is a strong alternative to Tableau and Power BI.
- Associative engine lets users explore freely across data
- Strong AI-assisted insights
- Cloud and on-premises options
- $30 per user per month starting price
- Pricing gets complex at scale
- Learning curve for advanced use
Sisense is best known for embedded analytics: putting dashboards and insights inside your own product so customers see their data without leaving your app. It handles large, complex datasets well, supports cloud and on-premises deployment, and adds generative AI features for asking questions in plain language. Product teams that sell analytics as part of their software often choose Sisense over general BI tools.
Pricing is custom and typically quoted from around $10,000 a year, which puts it out of reach for very small teams. Implementation also takes effort, especially for embedded use cases. For companies that need to ship analytics to customers, rather than just to internal teams, Sisense is one of the strongest options available.
- Strong embedded analytics for customer-facing products
- Handles large and complex data well
- AI features included
- Custom pricing, typically quoted from around $10,000 a year
- Implementation takes effort
Domo is an all-in-one cloud platform that connects data from more than 1,000 sources, prepares it, visualizes it and powers apps and alerts on top. Its executive dashboards are polished and easy to read, which is why leadership teams like it, and its connector library means most SaaS tools plug in without custom pipelines. AI chat features let users ask questions of their data in plain language.
Pricing is custom and typically enterprise-level, often quoted around $50,000 or more a year, so small teams should look elsewhere. Domo also bundles more than some teams need if they only want dashboards. For mid-size and large companies that want one platform from connectors to boardroom dashboards, Domo is a serious contender.
- More than 1,000 connectors
- Executive-friendly dashboards
- All-in-one data, BI and app platform
- Custom pricing, often quoted around $50,000-plus a year
- Can be more than small teams need
Metabase is the easiest open source BI tool for small teams, and our pick for startups that want real dashboards without a BI budget. The self-hosted edition is free, connects to more than 20 database types, and lets non-technical users ask questions through a visual builder without writing SQL. Setup takes minutes on a small server, and dashboards and alerts cover most small-team needs.
Cloud hosting starts with a Starter tier and rises to Pro at $500 or more per month and Enterprise above that, so teams that do not want to self-host should price the cloud plans carefully. Advanced permissions, serialization and AI features sit on paid tiers. For engineering-led teams happy to self-host, Metabase delivers remarkable value for free.
- Free self-hosted open source edition
- Easy setup with no SQL needed for basic questions
- Connects to 20-plus databases
- Cloud plans cost more than the free tier suggests
- Advanced features sit on Pro and Enterprise plans
Apache Superset is a fully free, open source data exploration and visualization platform, originally built at Airbnb and now a top-level Apache project. It offers a wide chart library, a SQL editor for analysts, dashboards with filters and alerts, and the ability to handle large datasets through database-native queries. There is no license cost at any scale.
The cost is operational: you host, secure, upgrade and scale it yourself, and setup needs data engineering skill. There is no vendor support unless you hire a third party. For technical teams that want a free, powerful BI layer they fully control, Superset is the most capable open source option here, and it pairs well with modern cloud warehouses.
- Completely free and open source
- Rich chart library
- Scales to large datasets
- Self-hosting and setup need data engineering skill
- No vendor support without a third party
Looker Studio, formerly Google Data Studio, is the easiest free way to build shareable dashboards, especially on Google data. The standard version is free, connects natively to Google Analytics, Sheets, BigQuery, Ads and many third-party sources, and makes sharing a dashboard as simple as sharing a document. Small businesses, marketers and agencies use it daily for client and team reporting.
It is weaker than Looker, Tableau or Power BI on governed modeling, complex calculations and very large datasets, and the Pro tier, quoted around $9 per user per month, adds team features and support. For free, fast, shareable dashboards, Looker Studio is unbeatable. For enterprise-grade governed BI, move up to one of the paid platforms on this list.
- Completely free for the standard version
- Easy sharing and collaboration
- Strong Google data connectors
- Weaker on governed modeling and very large datasets
- Pro tier adds cost for advanced features
ThoughtSpot flips the BI model: instead of building dashboards first, users type questions in plain language, such as sales by region last quarter, and get charts and answers instantly. Its Spotter AI assistant helps refine questions and explain results, and it works well on cloud warehouses like Snowflake, BigQuery and Databricks. That search-first approach suits business users who want answers without waiting for an analyst.
Pricing is custom and enterprise-oriented, with quoted figures often starting around $25 per user per month and rising, and a free trial is available. Teams that love building polished dashboards may prefer Tableau or Power BI. For organizations where self-service questioning matters more than dashboard design, ThoughtSpot offers a genuinely different and valuable experience.
- Search-based analytics lets users type questions in plain language
- AI-assisted insights
- Strong on cloud warehouses
- Custom pricing
- Search-first approach suits some teams better than dashboard builders
How we picked these
We compared official pricing pages, feature documentation and public reviews, and we only included platforms actively available in October 2026 with real dashboard and visualization capabilities. We mixed enterprise BI suites, embedded platforms, search-driven tools and free open source options so teams of every size find a fit. Pure chart libraries without a platform, and spreadsheet-only tools, were left out.
How to choose the right visualization platform
Start with who will build and who will read. If analysts build and executives read, a governed tool like Looker or a polished platform like Domo fits. If business users build their own dashboards, Power BI, Tableau or Qlik Sense fit better. If developers embed analytics into a product, Sisense or Looker lead. If budget is near zero, Metabase, Superset or Looker Studio cover most needs for free.
Next, check your data sources and your ecosystem. Power BI wins for Microsoft shops, Looker wins for BigQuery shops, and Tableau wins when visualization quality matters more than ecosystem. Count connectors for the tools you actually use, not the total list, and test performance on your real data volume, since demos on small datasets hide scaling problems.
Govern metrics before you scale dashboards
The most common BI failure is not a bad chart but ten dashboards that disagree on revenue. Pick one definition for each key metric, document it, and build certified datasets that teams reuse. Governed tools like Looker enforce this by design, while self-service tools need discipline and ownership to achieve it. A small number of trusted dashboards beats a large library of conflicting ones.
Trial on your own data
Run your top two choices on your real data for two weeks, with the people who will actually use them. Measure time to build a dashboard, time to answer a new question, sharing ease and performance on your largest tables. The platform your team enjoys using is the one that gets adopted, and adoption matters more than any feature checklist.
FAQ
What is the best data visualization platform for small businesses?
Power BI is the best value for most small businesses, with Desktop free and Pro at $14 per user per month. Metabase and Looker Studio are free alternatives that cover basic dashboards well. Tableau is stronger on visual exploration but costs more, so small teams usually start with Power BI or a free tool.
What is the difference between Tableau and Power BI?
Tableau leads on visual exploration quality, drag-and-drop analysis and community resources, with Creator at $75 per user per month. Power BI leads on price and Microsoft integration, with Pro at $14 per user per month and a free Desktop app. Choose Tableau for visualization depth and Power BI for value and Microsoft ecosystem fit.
Can I use a data visualization tool for free?
Yes. Metabase and Apache Superset are free when self-hosted, Looker Studio is free for standard use, and Power BI Desktop is free for building reports. Free options cover most small-team needs, though sharing, governance and support usually require a paid tier. Start free and pay only when collaboration or scale demands it.
Do I need a data warehouse to use these tools?
No, but it helps at scale. Most tools connect directly to spreadsheets, databases and SaaS apps for small deployments. As data grows across many sources, a warehouse like BigQuery, Snowflake or Redshift gives faster queries and cleaner modeling. Looker and ThoughtSpot are designed around warehouses, while Metabase and Power BI work well without one for smaller setups.
What is embedded analytics?
Embedded analytics means putting dashboards and insights inside your own product or website so customers see their data without opening a separate BI tool. Sisense and Looker are strong here, and Domo and Tableau offer embedding too. If you sell software and want analytics as a feature, prioritize embedding, permissions and white-labeling over internal dashboard features.
How much should a company budget for BI software?
Small teams can start free with Metabase, Superset or Looker Studio. Mid-size teams typically pay $14 to $30 per user per month for Power BI or Qlik Sense. Enterprise platforms like Tableau Creator at $75 per user per month, or Looker, Sisense and Domo on custom contracts, run much higher. Budget for licenses plus the analyst time to build and maintain dashboards.