Best Dashboard Software for Data Analytics in 2026: 8 Tools Compared
best dashboard software for data analytics compared in 2026: 8 tools for charts, reports, and live metrics, with pricing and free plans for teams today.
- Editor's choice
 Tableau
Deep visual analysis
Starts atSee websiteVisit tableau.comFull review - Great alternative
 Microsoft Power BI
Microsoft and Excel teams
Starts atSee websiteVisit powerbi.microsoft.comFull review - Also consider
 Looker Studio
Free dashboards for small teams
Starts atFreeVisit lookerstudio.google.comFull review
TL;DR:
- Tableau and Power BI lead for deep analysis, with Power BI winning on price for Microsoft shops.
- Looker Studio is the best free starting point for small teams and marketers.
- Metabase suits technical teams that want self-service questions without heavy BI setup.
- Domo and Zoho Analytics package data, dashboards, and alerts for business users.
- Test with your own data sources before buying, since connector coverage decides real value.
Quick comparison
| Tool | Best for | Starts at | Free plan? | |
|---|---|---|---|---|
| Tableau | Deep visual analysis | See website | Free trial | Visit |
| Microsoft Power BI | Microsoft and Excel teams | See website | Yes | Visit |
| Looker Studio | Free dashboards for small teams | Free | Yes | Visit |
 Metabase | Self-service questions | See website | Yes | Visit |
 Domo | Business dashboards and alerts | See website | Free trial | Visit |
 Zoho Analytics | Value BI with Zoho links | See website | Free trial | Visit |
 Klipfolio | KPI dashboards for teams | See website | Free trial | Visit |
 Databox | Marketing and sales metrics | See website | Yes | Visit |
The best dashboard software for data analytics
Dashboards fail when they show pretty charts that no one acts on. The tools below differ in who builds the dashboard, how live the data is, and how much technical help a team needs, so pick for the people who will maintain it, not just the people who will view it.
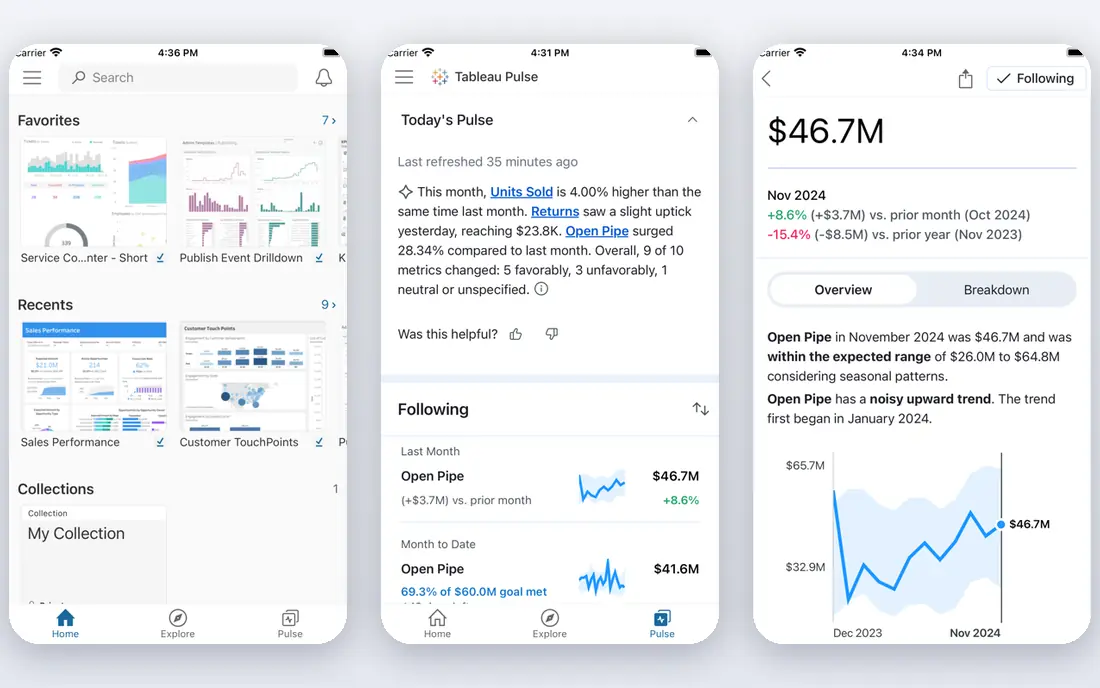
Tableau lets analysts explore data visually, build interactive dashboards, and answer follow-up questions without rebuilding reports each time. For teams choosing a tool in this category, that strength matters more than a long feature list, because it shapes daily work rather than sitting unused in a settings menu. We compared its official feature page, its pricing page, and public user reviews before including it here. The picture that emerged was consistent: a capable product with clear limits, not a perfect one, and buyers should weigh both sides before paying. The honest catch is this: Casual viewers may find its full authoring tools heavier than they need, so many teams pair a few Tableau creators with many viewers. If that trade-off fits your budget and your workflow, this is a solid pick. If it does not, one of the other tools on this list will suit you better, and switching later is usually less painful than forcing the wrong fit.
- Powerful visual exploration
- Large community
- Strong data connectors
- Premium pricing
- Learning curve for casual users

Power BI turns Excel data and many business sources into dashboards at a price that small firms can accept, with a free desktop authoring tool. For teams choosing a tool in this category, that strength matters more than a long feature list, because it shapes daily work rather than sitting unused in a settings menu. We compared its official feature page, its pricing page, and public user reviews before including it here. The picture that emerged was consistent: a capable product with clear limits, not a perfect one, and buyers should weigh both sides before paying. The honest catch is this: Sharing dashboards broadly needs paid capacity or per-user plans, so check the sharing cost for your full audience, not just creators. If that trade-off fits your budget and your workflow, this is a solid pick. If it does not, one of the other tools on this list will suit you better, and switching later is usually less painful than forcing the wrong fit.
- Low entry cost
- Strong Excel links
- Wide connector library
- Full sharing needs a paid plan
- Best experience stays inside Microsoft tools
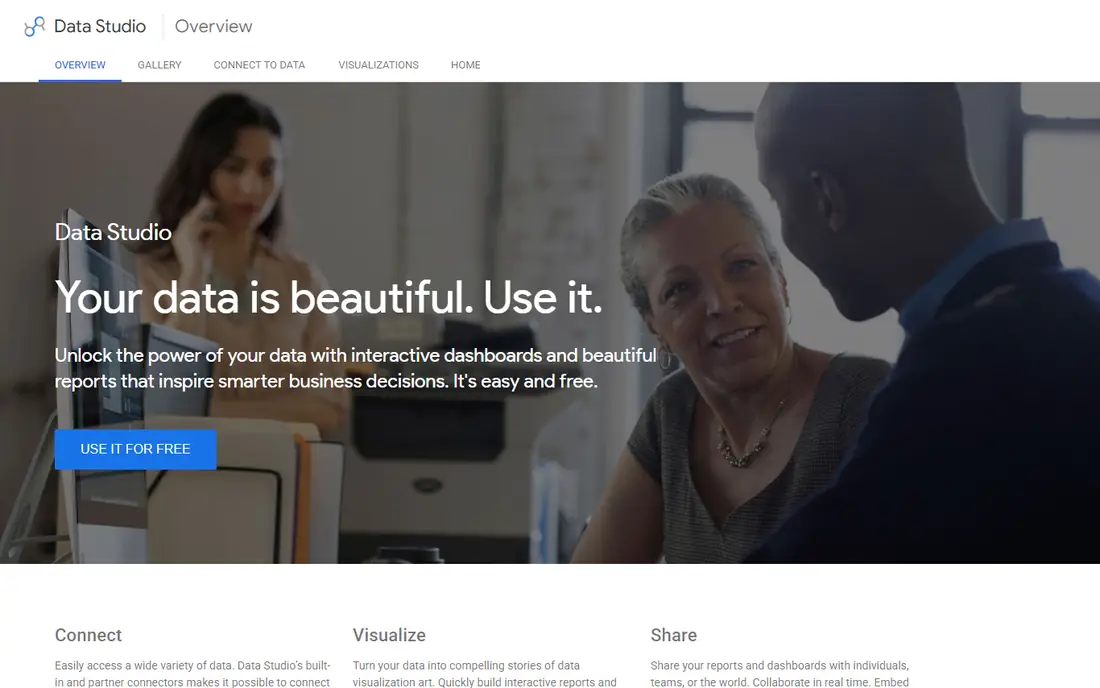
Looker Studio is free and easy for teams that already use Google Sheets, Analytics, or Ads, with simple sharing by link. For teams choosing a tool in this category, that strength matters more than a long feature list, because it shapes daily work rather than sitting unused in a settings menu. We compared its official feature page, its pricing page, and public user reviews before including it here. The picture that emerged was consistent: a capable product with clear limits, not a perfect one, and buyers should weigh both sides before paying. The honest catch is this: It lacks the modelling depth and governance of enterprise BI, so larger firms often outgrow it as data sources multiply. If that trade-off fits your budget and your workflow, this is a solid pick. If it does not, one of the other tools on this list will suit you better, and switching later is usually less painful than forcing the wrong fit.
- Free to use
- Easy Google data links
- Simple sharing
- Limited advanced modelling
- Fewer enterprise controls than paid BI tools
Metabase lets non-technical staff ask questions in plain terms and save the results as dashboards, without writing SQL for every chart. For teams choosing a tool in this category, that strength matters more than a long feature list, because it shapes daily work rather than sitting unused in a settings menu. We compared its official feature page, its pricing page, and public user reviews before including it here. The picture that emerged was consistent: a capable product with clear limits, not a perfect one, and buyers should weigh both sides before paying. The honest catch is this: Deeper data modelling still needs technical help, but its open-source edition gives small teams a low-cost way to start. If that trade-off fits your budget and your workflow, this is a solid pick. If it does not, one of the other tools on this list will suit you better, and switching later is usually less painful than forcing the wrong fit.
- Open-source option
- Natural question builder
- Easy embedding
- Advanced modelling needs technical skill
- Cloud pricing grows with users
Domo packages connectors, dashboards, alerts, and mobile views for business users who need live numbers without waiting on analysts. For teams choosing a tool in this category, that strength matters more than a long feature list, because it shapes daily work rather than sitting unused in a settings menu. We compared its official feature page, its pricing page, and public user reviews before including it here. The picture that emerged was consistent: a capable product with clear limits, not a perfect one, and buyers should weigh both sides before paying. The honest catch is this: Its pricing is quote-based and aimed at larger firms, so small teams should confirm costs before investing setup time. If that trade-off fits your budget and your workflow, this is a solid pick. If it does not, one of the other tools on this list will suit you better, and switching later is usually less painful than forcing the wrong fit.
- Many connectors
- Alerts and mobile dashboards
- Business-user focus
- Enterprise pricing
- Quote-based plans need sales talks
Zoho Analytics gives small and mid-sized firms dashboards, scheduled reports, and an AI assistant at a modest price. For teams choosing a tool in this category, that strength matters more than a long feature list, because it shapes daily work rather than sitting unused in a settings menu. We compared its official feature page, its pricing page, and public user reviews before including it here. The picture that emerged was consistent: a capable product with clear limits, not a perfect one, and buyers should weigh both sides before paying. The honest catch is this: It is strongest alongside other Zoho apps, though it also connects to common outside sources for standalone use. If that trade-off fits your budget and your workflow, this is a solid pick. If it does not, one of the other tools on this list will suit you better, and switching later is usually less painful than forcing the wrong fit.
- Affordable plans
- AI assistant for questions
- Many built-in connectors
- Visual polish trails Tableau
- Advanced users may want more modelling power
Klipfolio is built for visible KPI dashboards, with integrations that pull metrics into one screen for a team room or a weekly review. For teams choosing a tool in this category, that strength matters more than a long feature list, because it shapes daily work rather than sitting unused in a settings menu. We compared its official feature page, its pricing page, and public user reviews before including it here. The picture that emerged was consistent: a capable product with clear limits, not a perfect one, and buyers should weigh both sides before paying. The honest catch is this: Analysts who need deep exploration may find it lighter than Tableau or Power BI, but for KPI tracking it is fast to set up. If that trade-off fits your budget and your workflow, this is a solid pick. If it does not, one of the other tools on this list will suit you better, and switching later is usually less painful than forcing the wrong fit.
- Easy KPI dashboards
- Many integrations
- TV and wallboard display options
- Less suited to deep ad-hoc analysis
- Data modelling is lighter
Databox pulls marketing and sales metrics into scorecards and dashboards that update without manual spreadsheet work. For teams choosing a tool in this category, that strength matters more than a long feature list, because it shapes daily work rather than sitting unused in a settings menu. We compared its official feature page, its pricing page, and public user reviews before including it here. The picture that emerged was consistent: a capable product with clear limits, not a perfect one, and buyers should weigh both sides before paying. The honest catch is this: Its free plan limits how many metrics you can track, so count your sources before relying on the free tier for a whole team. If that trade-off fits your budget and your workflow, this is a solid pick. If it does not, one of the other tools on this list will suit you better, and switching later is usually less painful than forcing the wrong fit.
- Many marketing integrations
- Scorecards and goals
- Mobile dashboards
- Free plan limits metrics
- Deeper analysis needs higher plans
How we picked these
We started with the vendors own feature pages and pricing pages, then checked app store listings and public reviews for signs of real, current use. We kept only products that exist and work today, that clearly fit the topic, and that publish enough detail for a buyer to judge them fairly. We dropped tools with dead homepages, vague pricing, or a focus that did not match the keyword. Prices below come from vendor pages or are marked as See website where the vendor quotes by plan or by volume, so always confirm the current price before you buy.
Building dashboards people actually use
Start with one decision the dashboard must support, such as weekly sales review or marketing spend checks. Then list the exact metrics and sources that decision needs, and confirm each tool connects to those sources without manual exports. A dashboard fed by weekly CSV uploads will go stale, no matter how good it looks. Start with a short trial on real work, not a demo script. Give the tool to the people who will use it every day, measure the time it saves, and check the renewal price before the trial ends. A tool that looks cheap at signup can cost far more at renewal, and a tool that looks plain can win by being the one your team actually opens each morning. Finally, assign an owner for each dashboard. Someone must check the numbers, fix broken connectors, and retire charts that no longer guide a decision, or the dashboard slowly becomes decoration.
FAQ
What is the best dashboard software for beginners?
Looker Studio is the easiest free start, especially for teams using Google tools. Power BI is a strong next step for Excel users, and Metabase suits teams that want staff to ask their own questions. Choose the tool your team can maintain, since an unmaintained dashboard quickly loses trust.
Is Tableau better than Power BI?
Tableau often wins for deep visual exploration and analyst flexibility, while Power BI usually wins on price and Microsoft integration. Firms already using Microsoft 365 and Excel often get more value from Power BI. Firms with dedicated analysts and varied data sources often prefer Tableau. Test both with your own data.
Do I need a data warehouse first?
Not for a first dashboard. Most tools here connect directly to spreadsheets, CRMs, and common apps. A warehouse becomes useful when you combine many sources, need consistent definitions, or hit performance limits. Start simple, and add a warehouse when manual data work becomes a weekly burden.
How much does dashboard software cost?
Costs range from free for Looker Studio and open-source Metabase to per-user monthly plans for Power BI, Tableau, and Zoho Analytics, with Domo priced by quote. Count viewers as well as creators, since viewer licenses often decide the total bill. Always confirm sharing and viewer pricing before rollout.
How do I keep dashboards accurate?
Use live connectors where possible, document each metric definition in plain words, and review dashboards monthly for broken sources or outdated targets. Limit who can edit core metrics, and keep a change log when definitions shift. Accuracy habits matter more than chart style.