Best Cloud Monitoring Software in 2026: 8 Platforms Compared
Compare the best cloud monitoring software in 2026, from Datadog and New Relic to AWS and Azure tools, with pricing models and fit for each team size.

- Editor's choice
 Datadog
All-in-one observability
Starts at$15 per host per monthVisit datadoghq.comFull review - Great alternative
 New Relic
Usage-based monitoring
Starts atFreeVisit newrelic.comFull review - Also consider
 Dynatrace
Enterprise root-cause analysis
Starts atSee websiteVisit dynatrace.comFull review
TL;DR:
- Datadog suits teams that want metrics, logs and traces in one platform, but bills can grow with hosts and data volume.
- New Relic offers a useful free tier and usage-based pricing that suits startups and smaller engineering teams.
- Dynatrace fits large enterprises with complex systems, thanks to automatic dependency mapping and root-cause analysis.
- AWS CloudWatch, Azure Monitor and Google Cloud Monitoring are the natural picks inside their own clouds.
- Grafana Cloud appeals to teams that already use Prometheus and open-source dashboards.
Quick comparison
| Tool | Best for | Starts at | Free plan? | |
|---|---|---|---|---|
| Datadog | All-in-one observability | $15 per host per month | Free trial | Visit |
| New Relic | Usage-based monitoring | Free | Yes | Visit |
| Dynatrace | Enterprise root-cause analysis | See website | Free trial | Visit |
 AWS CloudWatch | AWS workloads | Pay as you go | Yes | Visit |
 Azure Monitor | Azure workloads | Pay as you go | Yes | Visit |
 Google Cloud Monitoring | Google Cloud workloads | Pay as you go | Yes | Visit |
 Grafana Cloud | Open-source stacks | $19 per month plus usage | Yes | Visit |
 LogicMonitor | Hybrid infrastructure | See website | Free trial | Visit |
The best cloud monitoring software
We compared official pricing pages, feature lists and integration catalogues to find the best cloud monitoring tool and the best cloud monitoring platform for different team sizes and cloud mixes.

Datadog is the default shortlist pick for cloud-native teams that want one vendor for most observability needs. Its integrations cover major clouds, containers, databases and common SaaS tools, and dashboards can combine infrastructure health with application traces. That breadth saves time when an incident spans several services.
The catch is cost control. Each added host, custom metric and gigabyte of logs adds to the bill, so teams need retention rules and cardinality limits from day one. If you set those guardrails early, Datadog is a powerful and flexible platform.
- Broad integration catalogue
- Metrics, logs, traces and alerts in one place
- Strong dashboards
- Costs rise quickly with hosts, custom metrics and log volume
- Billing can be hard to predict
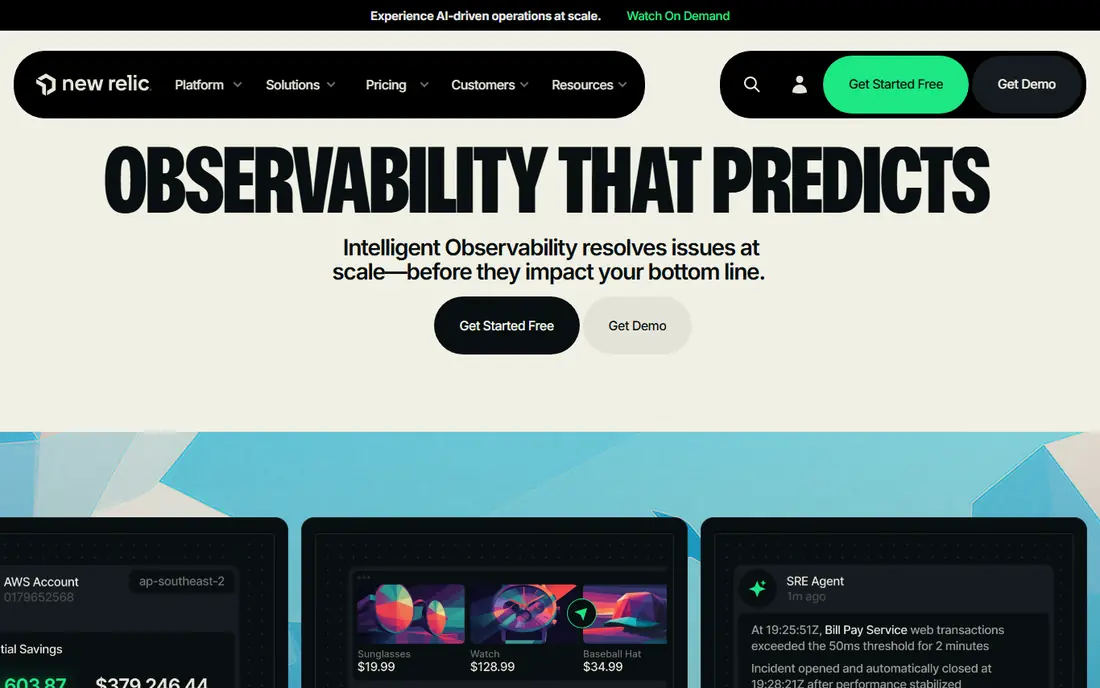
New Relic rebuilt its pricing around data ingest and user seats, which makes it easier for small teams to start without a large contract. The free tier covers a useful amount of monthly data, and teams can add application monitoring, infrastructure monitoring and browser monitoring under one account. For startups, that low entry cost matters.
As data grows, costs grow too, so teams should watch ingest and set drop rules for noisy logs. Compared with per-host pricing, though, New Relic often gives smaller teams a clearer path to scale.
- Generous free data allowance
- Full platform access on one model
- Clear per-user and usage pricing
- Large data volumes still cost real money
- Some advanced features need paid user seats

Dynatrace installs an agent that maps services, dependencies and hosts with little manual setup. When a problem appears, it tries to point to the likely root cause rather than showing a long list of alerts. Large enterprises with hundreds of services gain the most from that approach.
The trade-off is price and complexity. Dynatrace uses a consumption model based on platform units, so buyers should run a proof of concept with realistic traffic before signing. For a large, complex estate, it is one of the strongest tools available.
- Automatic service mapping
- AI-based root-cause analysis
- Strong enterprise security and scale
- Pricing is consumption-based and complex
- Smaller teams may find it more than they need
AWS CloudWatch is the obvious first choice for teams that run mainly on AWS. It collects metrics from EC2, Lambda, RDS and other services without separate setup, and alarms can trigger scaling or notifications. Teams can also send custom metrics and logs from their own applications.
Its limits appear in multi-cloud setups, where a single view across AWS, Azure and Google Cloud takes extra tooling. Log costs also need attention, since verbose logging can surprise a budget. Inside AWS, it is hard to beat for value and fit.
- Native AWS integration
- No extra agent for many services
- Alarms and dashboards built in
- Costs grow with metrics and logs
- Multi-cloud views require extra work
Azure Monitor covers Azure virtual machines, containers, databases and applications from one service. Log Analytics lets engineers query across resources, while Application Insights tracks app performance and failures. For firms already on Azure, the setup burden is low.
The learning curve is real, since the query language and workspace model take time to master. Data ingest and retention settings also drive cost, so teams should set caps early. Within Azure, it is a solid and well-integrated choice.
- Native Azure integration
- Log Analytics for deep queries
- Workbooks for shared dashboards
- Query language takes time to learn
- Costs depend on data ingest and retention
Google Cloud Monitoring, part of Google Cloud Observability, tracks Compute Engine, Google Kubernetes Engine and other Google services. It handles uptime checks, alert policies and dashboards, and it works well for container-heavy teams. Pricing is usage-based, with a free allowance for many metrics.
Teams running several clouds will still need a third-party tool for a unified view. As a Google Cloud native option, it is fast to set up and easy to keep within budget for smaller estates.
- Native Google Cloud integration
- Good Kubernetes support
- Simple alert policies
- Less useful as a single pane for other clouds
- Some features are Google Cloud specific
Grafana Cloud appeals to teams that already use Prometheus or want open standards. Dashboards are highly flexible, alerts can span metrics, logs and traces, and the free tier covers small projects. Larger teams pay a platform fee plus usage for active series, logs and traces.
The honest catch is that flexibility brings work. Teams must still design good dashboards, labels and retention rules. If your engineers already know the Grafana stack, that work feels natural rather than burdensome.
- Built on Prometheus, Loki and Tempo
- Flexible dashboards
- Free tier for small teams
- Usage charges add up with series and logs
- Self-hosting the open-source stack takes effort
LogicMonitor suits IT teams that manage a mix of cloud services, servers, storage and network gear. It discovers devices automatically, applies templates for common systems, and shows health across the whole estate. That hybrid coverage is its main strength.
Small cloud-only teams may find it heavier than Datadog or New Relic, and pricing needs a sales quote. For mixed estates where network and server monitoring matter as much as cloud metrics, it is a strong contender.
- Covers cloud, on-premises and network devices
- Automatic device discovery
- Useful forecasting
- Pricing is quote-based
- Interface can feel dense for small teams
How we picked these
We compared official pricing pages, documentation and integration lists, and we favoured tools that are actively maintained and widely used in 2026. We did not claim hands-on testing. We used See website or pay-as-you-go where a vendor does not publish one simple starting price, since cloud monitoring bills depend on hosts, data and retention.
How to choose a cloud monitoring platform
Start with where your systems actually run. A single-cloud team usually gets the best value from that cloud's native tool, while a multi-cloud team benefits from a vendor-neutral platform. List your must-have signals next: infrastructure metrics, application traces, logs, synthetic checks and user experience data.
Controlling cost
Set retention limits, drop noisy logs and limit high-cardinality labels before you onboard every service. Run a trial with production-like traffic and check the bill at the end of the first month. Alert rules also matter: too many alerts teach teams to ignore them, while too few leave outages hidden.
Alerts and incident response
Good monitoring should page the right person, link to the relevant dashboard and show recent changes. Check on-call integrations, alert grouping and support for runbooks. A tool that only collects data, without a clear path from alert to fix, will not help during a real outage.
Dashboards for different roles
Build separate dashboards for engineering, support and management, rather than one crowded view for everyone. Engineers need service health, error rates and recent deploys. Support teams need customer impact and known incidents. Managers need uptime trends and the largest sources of alerts. When each group sees only what it needs, dashboards get used instead of ignored.
Review alert rules every month. Remove alerts that never lead to action, tune thresholds for noisy services, and group related alerts so one outage does not create fifty pages. A quieter alert system is a safer one, because on-call staff pay attention when a real alert arrives.
FAQ
What is the best cloud monitoring tool for a small team?
New Relic and Grafana Cloud are good starting points, thanks to free tiers and usage-based pricing. AWS CloudWatch, Azure Monitor or Google Cloud Monitoring also suit small teams inside a single cloud. Start small, then add paid features only when alerts prove their value.
What is the best cloud monitoring platform for enterprises?
Datadog and Dynatrace lead for large, complex estates, with broad integrations and root-cause analysis. LogicMonitor also fits hybrid estates with network gear. Enterprises should run a proof of concept and negotiate pricing based on real usage.
How much does cloud monitoring cost?
Costs vary widely by hosts, data volume and retention. Native cloud tools charge per metric, log gigabyte and alarm, while SaaS platforms charge per host, per user or per unit of data. A small team may pay nothing or tens of dollars a month, while a large estate can reach thousands.
Do I need APM as well as infrastructure monitoring?
Infrastructure monitoring shows host and container health, while application performance monitoring shows slow code, failed requests and database queries. Most teams need both once an app serves real users. Start with infrastructure, then add APM for your most important services.
Can one tool monitor AWS, Azure and Google Cloud?
Yes, Datadog, New Relic, Dynatrace, Grafana Cloud and LogicMonitor all support multiple clouds. Native tools can also export data, but a vendor-neutral platform gives a single dashboard more easily. Check that your chosen tool supports every service you run.