Best Business Intelligence Tools in 2026: 8 Tools Compared
Compare the best business intelligence tools for 2026, from Power BI and Tableau to Looker, Qlik, and Zoho Analytics, with pricing and best fits today.
- Editor's choice
 Microsoft Power BI
Microsoft-centric teams
Starts at$14 per user per monthVisit powerbi.microsoft.comFull review - Great alternative
 Tableau
Visual exploration
Starts atSee websiteVisit tableau.comFull review - Also consider
 Looker Studio
Free dashboards
Starts atFreeVisit lookerstudio.google.comFull review
TL;DR:
- Power BI is the value pick for Microsoft-centric teams, while Tableau leads on visual exploration.
- Looker suits teams that need one governed definition of each metric across the company.
- Zoho Analytics is the most affordable route to real BI for small teams.
- Budget for viewers as well as builders, since per-seat costs surprise many teams.
- A BI tool only helps if data is clean and metrics are agreed, so fix definitions before buying dashboards.
Quick comparison
| Tool | Best for | Starts at | Free plan? | |
|---|---|---|---|---|
| Microsoft Power BI | Microsoft-centric teams | $14 per user per month | Yes | Visit |
| Tableau | Visual exploration | See website | Free trial | Visit |
| Looker Studio | Free dashboards | Free | Yes | Visit |
 Qlik Sense | Associative exploration | See website | Free trial | Visit |
 ThoughtSpot | Search-based analytics | See website | Free trial | Visit |
 Domo | All-in-one data apps | See website | Free trial | Visit |
 Sisense | Embedded analytics | See website | Free trial | Visit |
 Zoho Analytics | Small business BI | $24 per month | Yes | Visit |
The best business intelligence tools
We compared official feature pages, pricing pages, and public reviews, and we focused on data connections, dashboard building, sharing costs, governance, and ease of use for non-technical staff.
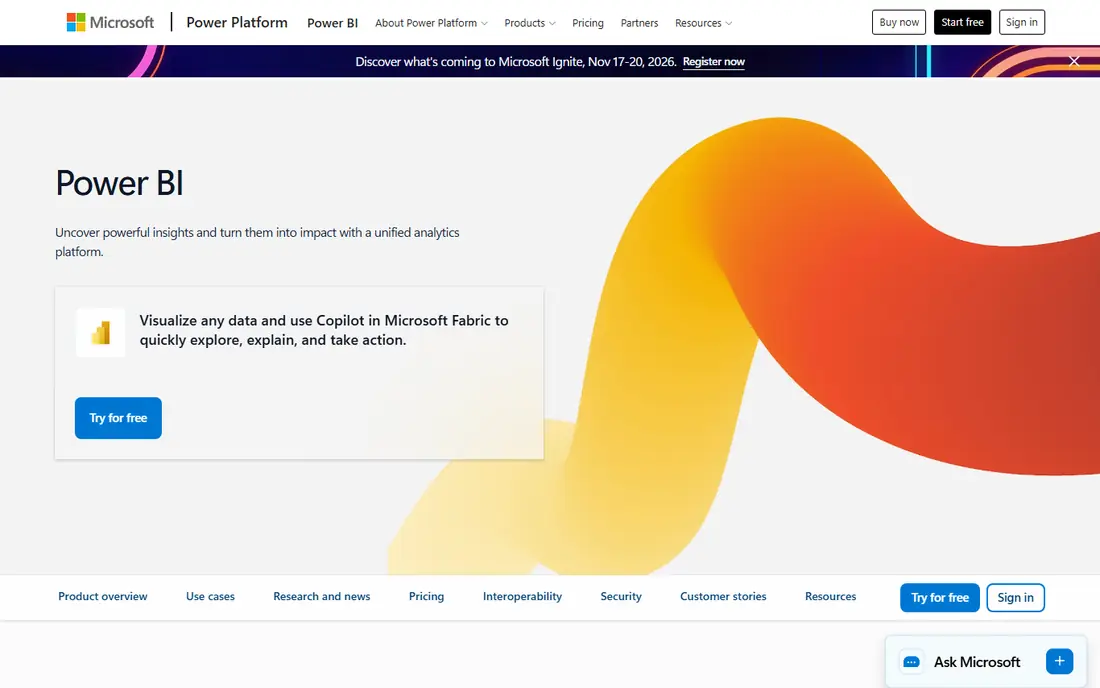
Power BI is the default choice for teams already using Microsoft 365, Excel, and Teams. The Desktop app is free for building reports, the Pro license is affordable compared with enterprise rivals, and connectors cover common business apps and databases. DAX modeling gives analysts real power once they learn it.
Sharing is where costs appear. Viewers generally need a license or a capacity plan, so count everyone who will read dashboards, not just the people who build them. For Microsoft shops that accept that model, Power BI offers the best balance of price and capability in this list.
- Strong value for Microsoft 365 users
- Desktop app is free to build reports
- Wide connector library and DAX modeling
- Sharing reports needs a paid license or capacity
- Learning DAX takes time for advanced models
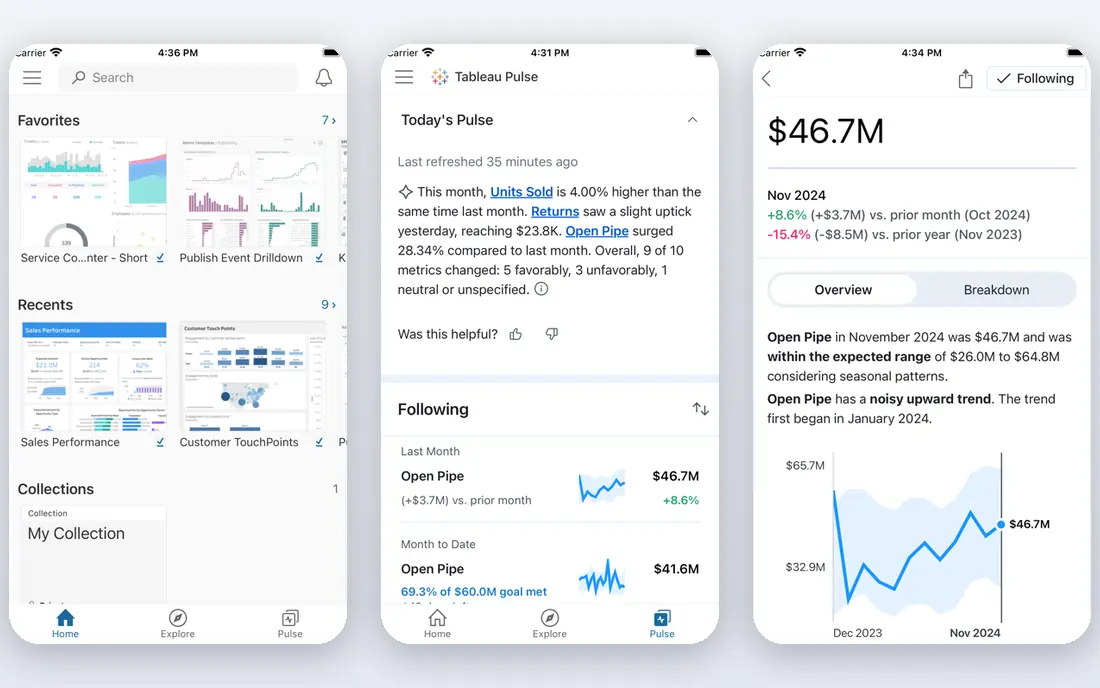
Tableau remains the tool analysts pick when exploration matters most. Drag-and-drop visuals, filters, and calculations make it easy to ask follow-up questions of data without writing code for every view. The community, templates, and training resources are extensive, which helps new analysts learn faster.
Pricing is the main drawback, since Creator, Explorer, and Viewer roles carry different costs and the total depends on your mix. Tableau also rewards skilled users more than casual ones, so teams without analysts may underuse it. For visual, question-led analysis, Tableau is still the benchmark.
- Excellent visual exploration and interactivity
- Strong community and learning resources
- Flexible data connections
- Per-seat pricing rises with role mix
- Advanced features need skilled analysts
Looker Studio, formerly Google Data Studio, is the free entry point for dashboards. Anyone with a Google account can connect Sheets, Analytics, or BigQuery, build a report, and share it with a link. For small teams, startups, and marketing reports, that simplicity is enough.
It is not a full enterprise BI platform. Governance, semantic modeling, and large-data performance are weaker than in Looker, the paid Google Cloud product, and some connectors are community-built. If you need free, shareable dashboards and your data lives in Google tools, Looker Studio is an easy win.
- Free to use
- Easy Google Sheets, Analytics, and BigQuery connections
- Simple sharing with a link
- Limited governance and modeling compared with Looker
- Connector and performance limits on large data
Qlik Sense uses an associative engine, which means filtering one field instantly shows what is related and what is excluded across the whole dataset. That approach helps analysts spot patterns they might miss in a fixed dashboard. It also blends data from many sources and offers AI-assisted chart suggestions.
The learning curve and pricing are the trade-offs. Small teams may find plan pricing high, and the interface rewards training. For power users who explore data freely rather than reading fixed reports, Qlik Sense is a distinctive and capable tool.
- Associative engine shows related data as you filter
- Strong multi-source blending
- AI-assisted insights
- Pricing is plan-based and can be high for small teams
- Interface takes time to learn
ThoughtSpot suits teams where business users, not just analysts, need answers. You type a question in plain language, such as sales by region last quarter, and get a chart you can refine. AI features help with follow-up questions and anomaly alerts, which lowers the barrier for casual users.
Behind that simplicity, data modeling still matters. Someone must define metrics and connections well, or search answers will mislead. Pricing is also sales-led, so get a clear quote for your user count. If self-serve search is your goal, ThoughtSpot is one of the best tools for it.
- Search data in plain language
- AI analyst features for follow-up questions
- Good for non-technical users
- Pricing is sales-led
- Modeling and governance work still needs data team input
Domo combines data ingestion, transformation, dashboards, and alerts in one cloud platform. Its connector library is large, its mobile experience is polished, and teams can build data apps, not just reports, for managers on the move. That breadth suits fast-moving companies that want one platform for many data jobs.
Pricing is consumption-based, which makes budgeting harder than a simple per-seat plan. Smaller teams should ask for a usage estimate based on their data volume and user count before committing. For mid-size and larger teams that use Domo daily, the all-in-one approach can replace several separate tools.
- Many connectors and built-in ETL
- Mobile dashboards are strong
- Combines BI with data apps and alerts
- Consumption-based pricing needs forecasting
- Can be expensive for smaller teams
Sisense is built for software companies that want analytics inside their own product. Dashboards can be embedded, white-labeled, and customized with SDKs, so customers see charts that feel native to the app. Its engine handles large and complex datasets well, which matters for product analytics.
For simple internal reporting, Sisense is more than most teams need, and quote-based pricing reflects that enterprise focus. If you are a product team that needs customer-facing analytics, Sisense is a leading choice. If you only need internal dashboards, a cheaper tool will serve you better.
- Strong embedding and white-label options
- Developer SDKs
- Handles large, complex datasets
- Pricing is quote-based
- Best fit is product teams, not casual internal reporting
Zoho Analytics is the budget pick for small businesses that want real BI without enterprise pricing. Plans start affordably, a free tier covers basic use, and the AI assistant can answer questions and suggest insights. Integration with Zoho CRM, Books, and other apps helps small teams that already use Zoho.
Advanced users will hit limits sooner than with Power BI or Tableau, especially on modeling and row counts. Check plan limits against your data size before committing. For a growing small business that needs dashboards, scheduled reports, and sharing, Zoho Analytics offers strong value.
- Affordable pricing with a free plan
- AI assistant for questions and insights
- Integrates with Zoho apps and common tools
- Less powerful than Tableau or Power BI for advanced modeling
- Row and user limits vary by plan
How we picked these
We compared official feature pages, pricing pages, and public reviews, and we favored tools available in October 2026 with clear data connectors, dashboard sharing, and governance options. We included free, mid-priced, and enterprise tools, including Looker Studio for small teams. We did not claim hands-on testing, and we treated pricing as plan-dependent, since seat mix and data volume change the total.
How to choose a BI tool
Count viewers, not just builders
Most BI pricing charges for everyone who views a dashboard, so list every manager and team member who needs access. A tool that looks cheap for three analysts can become expensive for fifty viewers, which is why free and viewer-friendly options matter.
Agree metrics before building dashboards
Decide what revenue, active users, or churn means in your company, and write it down. A governed metric layer, such as the one Looker provides, prevents teams from arguing over different numbers. Without that agreement, even the best tool will produce conflicting reports.
Test with your real data
Run a trial with your actual databases and spreadsheets, not demo data. Check connector reliability, refresh speed, and performance on your largest tables, since those issues only appear with real volume.
FAQ
What is the best business intelligence tool?
Power BI is the best value for Microsoft teams, Tableau leads on visual exploration, and Looker suits governed metrics. Small teams should start with Zoho Analytics or Looker Studio, depending on budget and technical skill.
What is the difference between BI tools and dashboard tools?
Dashboard tools mainly display data, while BI tools also connect, model, clean, and govern data before it reaches a dashboard. Looker Studio is closer to a dashboard tool, while Power BI, Tableau, and Looker offer fuller BI modeling.
How much do business intelligence tools cost?
Costs range from free for Looker Studio to $14 per user per month for Power BI Pro and quote-based enterprise pricing for Domo, Sisense, and ThoughtSpot. Always budget for viewers and data volume, not just builders.
Is Power BI better than Tableau?
Power BI wins on price and Microsoft integration, while Tableau wins on visual exploration and flexibility for skilled analysts. Teams already on Microsoft 365 usually pick Power BI, while analyst-led teams often prefer Tableau.
Can small businesses use BI tools?
Yes. Zoho Analytics and Looker Studio give small teams dashboards, alerts, and sharing at low or no cost. Start with one data source and a few key reports, then expand as data skills grow.
What is the best free business intelligence tool?
Looker Studio is the easiest free option for Google-based data, covering basic dashboards well, with paid options adding governance and capacity.