Best BI Tools for Small Businesses in 2026: 8 Tools Compared
We compared the best bi tools for small businesses for dashboards, reports and simple analysis, with current pricing, free plans and honest trade-offs.

- Editor's choice
 Looker Studio
Free Google dashboards
Starts atFreeVisit lookerstudio.google.comFull review - Great alternative
 Power BI
Microsoft ecosystem reporting
Starts at$14 per user per monthVisit powerbi.microsoft.comFull review - Also consider
 Zoho Analytics
Guided small-business dashboards
Starts at$24 per monthVisit zoho.comFull review
TL;DR:
- Looker Studio is the best free starting point for small teams, especially those already using Google Sheets and Analytics.
- Power BI is the strongest pick for Microsoft-based teams, with a free desktop app and affordable per-user pricing.
- Zoho Analytics and Metabase suit small teams that want guided dashboards or open-source flexibility without enterprise cost.
- Tableau is the most capable for complex visuals, but its price and learning curve make it overkill for many small businesses.
Quick comparison
| Tool | Best for | Starts at | Free plan? | |
|---|---|---|---|---|
| Looker Studio | Free Google dashboards | Free | Yes | Visit |
| Power BI | Microsoft ecosystem reporting | $14 per user per month | Yes | Visit |
| Zoho Analytics | Guided small-business dashboards | $24 per month | Free trial | Visit |
 Metabase | Open-source dashboards | Free | Yes | Visit |
 Tableau | Complex visual analysis | $15 per user per month | Free trial | Visit |
 Qlik Sense | Associative data exploration | See website | Free trial | Visit |
 ThoughtSpot | Search-driven analysis | $25 per user per month | Free trial | Visit |
 Domo | Connected business dashboards | See website | Free trial | Visit |
The best BI tools for small businesses
Small-business BI is not about the most powerful engine. It is about getting sales, marketing and finance data into a dashboard that non-technical staff can read and trust. We compared official pricing, feature pages and public reviews, favouring tools with a realistic small-business price and a gentle learning curve.

Looker Studio is the easiest place to start, because it costs nothing and connects well to the tools many small businesses already use. You can turn a Google Sheet, Analytics account or advertising account into a shareable dashboard in an afternoon, without buying software or hiring an analyst. Sharing by link makes it simple to send reports to partners or staff.
The limits appear as a business grows. Governance, metric definitions and access control are weaker than in paid BI platforms, and data blending can get messy with many sources. For a small team that needs clear weekly or monthly reporting, those limits rarely matter. For a larger team that needs one trusted definition of revenue, a paid tool is safer.
- Free to use
- Strong Google Sheets and Analytics links
- Easy sharing
- Weaker governance for larger teams
- Limited native AI analysis
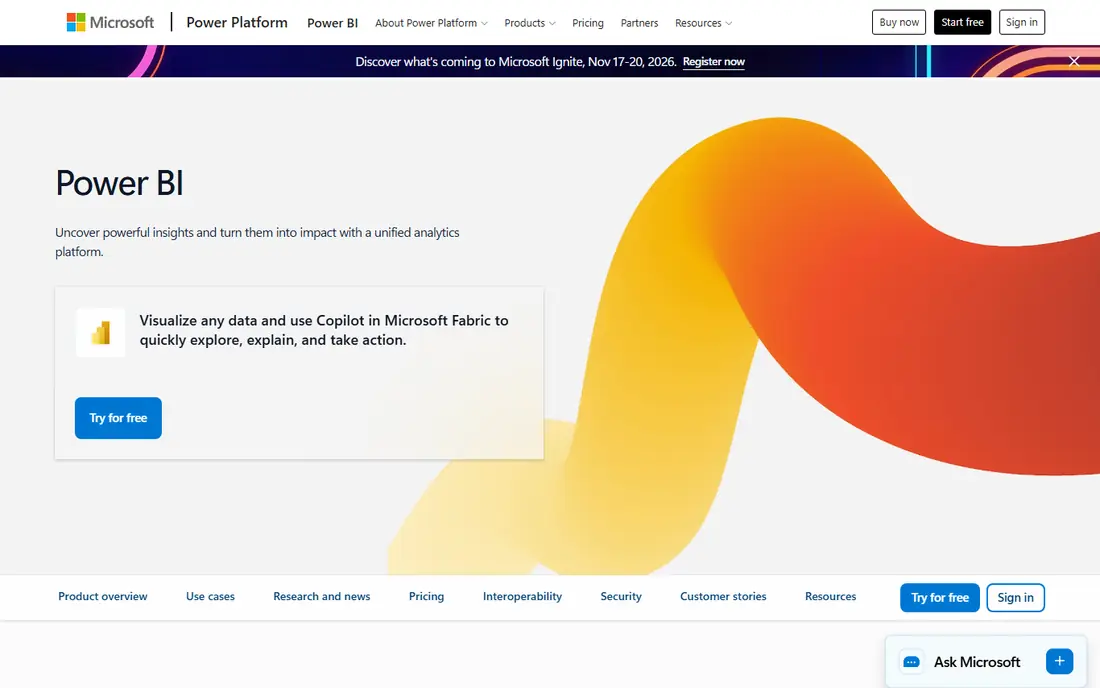
Power BI is the natural choice if your business runs on Microsoft 365, Excel and Teams. The desktop app is free for building reports, and the paid Pro licence adds sharing and collaboration at a price most small teams can justify. Links to Excel, SharePoint and common business apps make it practical for finance and operations reporting.
Sharing is the catch to budget for. Viewers generally need a Pro licence too, so costs rise with team size, and the DAX formula language takes practice for custom calculations. If your team already uses Microsoft tools, those costs are usually worth it. If you are Google-based, Looker Studio may be simpler.
- Free desktop app
- Strong Excel and Microsoft 365 links
- Large template and community range
- Sharing needs paid licences
- DAX formulas take time to learn

Zoho Analytics is designed for non-technical users, and it shows. Guided setup, prebuilt dashboards and an AI assistant that suggests insights help a small team move from spreadsheets to dashboards without learning a query language. Connectors cover common CRM, finance, marketing and spreadsheet sources, and pricing is by organisation rather than only per user on entry plans.
It is less suited to teams that need heavy data modelling or warehouse-level work. Analysts who want full SQL control may find Metabase or Power BI more flexible. For owners and managers who want clear answers without a data team, Zoho Analytics hits a sweet spot.
- Guided setup and AI-assisted insights
- Many built-in connectors
- Affordable team pricing
- Less depth for heavy data modelling
- Best inside the Zoho ecosystem
Metabase appeals to small teams with some technical skill and a tight budget. The open-source version can be self-hosted for free, with both a visual question builder for non-technical users and full SQL for analysts. Dashboards are clean, embedding is straightforward, and you keep control of your own data and hosting.
Self-hosting is also the main drawback. Updates, backups and security become your job, and the paid cloud version costs more once you pass the starter tier. Teams without anyone comfortable running a server should use the cloud plan or choose Zoho Analytics instead.
- Free self-hosted option
- SQL and no-code query modes
- Easy embedding
- Self-hosting needs technical care
- Cloud pricing rises with users
Tableau remains the benchmark for visual exploration. Its drag-and-drop analysis, filtering and dashboard design handle complex questions better than most small-business tools, and it scales well as data grows. Viewer pricing is reasonable, which helps when many staff only need to read dashboards.
The full cost is higher than the viewer price suggests, because anyone who builds dashboards needs a Creator licence at a much higher monthly rate. Training also takes time, so small teams should only choose Tableau when they have a dedicated analyst or a clear need for deep visual work.
- Excellent visual analysis
- Strong handling of large data
- Broad connector range
- Creator licences cost much more
- Learning curve for builders
Qlik Sense takes a different approach to exploration. Its associative engine shows how selections relate across fields, so users can spot connections that a fixed dashboard might hide. That makes it strong for managers who like to explore data by asking follow-up questions, rather than reading a static report.
Pricing and setup are the barriers for the smallest businesses. Published starting prices vary, and implementation can feel heavier than Looker Studio or Zoho Analytics. It fits small teams with an analyst mindset and growing data needs, rather than a first dashboard for a five-person company.
- Associative engine for exploring related data
- Strong data preparation
- Good mobile dashboards
- Pricing is less transparent
- Setup can feel heavy for very small teams
ThoughtSpot lets business users type a question in plain language, such as sales by region last quarter, and get a chart back without building a dashboard first. That search-first design suits managers who want quick answers and do not want to wait for an analyst. Liveboards then save the most useful answers as shared dashboards.
It works best when data is already clean and well modelled, which may need analyst help at the start. Entry pricing is also higher than Looker Studio or Power BI for small teams. If your main problem is slow access to answers, ThoughtSpot is worth a trial. If your main problem is basic reporting, a cheaper tool will do.
- Search-like questions in plain language
- AI-assisted answers
- Liveboard dashboards
- Higher entry price
- Needs clean, well-modelled data to shine
Domo connects a wide range of business apps into dashboards that work well on mobile, with alerts when a metric changes and comments for team discussion. That combination suits owners who check performance on a phone and want to act on a number without opening a laptop. Its connector library is a real strength for mixed app stacks.
Custom pricing is the main drawback for small businesses, since you need a sales conversation to get a firm figure. Domo can also feel like a large platform for a team that only needs a few dashboards. It fits growing small businesses with many data sources, rather than a first BI purchase.
- Many connectors
- Mobile-friendly dashboards
- Alerts and collaboration built in
- Custom pricing
- Can be more platform than a small team needs
How we picked these
We compared official pricing pages, feature pages and public reviews for BI tools that are actively sold in October 2026 and that a small business can realistically buy and run. We favoured free or low entry pricing, usable dashboards for non-technical staff, and connectors for common small-business sources such as spreadsheets, CRM and accounting tools. Enterprise-only platforms with no small-business path were left out.
What to check before you choose
Start with one question, not a platform
Pick the single report your business checks most, such as weekly sales or cash position, and build that first. If a tool cannot produce that report cleanly in a trial, it will not serve you better on a larger project. A working first dashboard teaches you more than a feature comparison ever will.
Count viewers, not just builders
BI pricing often separates builders from viewers, and viewer costs decide the real bill. List everyone who will read dashboards, including managers and partners, and check whether they need a paid licence. Looker Studio and Metabase open source avoid this cost, while Power BI and Tableau charge for most viewers.
Check your data sources first
A beautiful tool is useless if it cannot connect to your accounting, CRM or shop system without manual exports. Test your actual sources during the trial, including refresh frequency and how dates and currencies are handled. Manual spreadsheet uploads may work at first, but they become a chore that kills dashboard use.
Keep definitions simple
Agree on what revenue, profit and active customer mean before you build many dashboards. Different tools and different builders can produce different numbers from the same data, and that erodes trust fast. One owner for each key metric, plus a short written definition, prevents most BI arguments.
FAQ
Which bi tools are best for small businesses on a tight budget?
Looker Studio is free and the best budget starting point, followed by Metabase open source for teams with technical help. Power BI desktop is also free for building, though sharing needs paid licences. Zoho Analytics offers good value when you want guided setup without a free-tool learning curve.
What is the best bi software for small business teams using Microsoft 365?
Power BI is the clear pick for Microsoft 365 teams, thanks to Excel, SharePoint and Teams links and a familiar interface. It keeps reporting inside tools staff already use, and Pro pricing is reasonable for small teams. Google-based teams should compare Looker Studio first, since it offers a similar advantage there.
Do small businesses need Tableau?
Most small businesses do not need Tableau at first. It is excellent for complex visual analysis and large data, but Creator pricing and training make it a bigger commitment than Looker Studio, Zoho Analytics or Power BI. Choose Tableau when you have an analyst and questions that simpler tools cannot answer well.
Is free BI software good enough for a small business?
Free tools cover weekly sales, marketing and finance reporting for many small businesses, especially with spreadsheets and Google or Microsoft data. Limits appear in governance, automation and support as teams grow. Start free, and move to a paid tool when refresh, access control or data volume becomes a real problem.
How long does it take to set up a small-business BI dashboard?
A simple dashboard from a spreadsheet or Google Analytics can take an afternoon in Looker Studio or Zoho Analytics. A connected dashboard across CRM, accounting and advertising usually takes days to a few weeks, depending on data cleanliness. Allow extra time for agreeing metric definitions and testing numbers against your existing reports.