Best Application Performance Monitoring Software in 2026: 8 Tools Compared
Compare the best application performance monitoring software, including Datadog, New Relic, Dynatrace and Grafana Cloud, with pricing, billing models and fit.

- Editor's choice
 Datadog
All-in-one cloud observability
Starts at$31 per host per monthVisit datadoghq.comFull review - Great alternative
 New Relic
Usage-based observability
Starts atSee websiteVisit newrelic.comFull review - Also consider
 Dynatrace
Enterprise root cause analysis
Starts at$58 per host per monthVisit dynatrace.comFull review
TL;DR:
- Datadog is the all-in-one standard for cloud-native teams, with APM from $31 per host a month in recent comparisons.
- New Relic is the best starting point for startups, with 100 GB of free data ingest a month.
- Dynatrace leads on automatic root cause analysis for large enterprises, at about $58 per host a month in recent comparisons.
- Grafana Cloud and Sentry offer the strongest free tiers for open-source and developer-led teams.
- APM bills grow by hosts, data volume or users, so match the pricing model to your fleet shape before you buy.
Quick comparison
| Tool | Best for | Starts at | Free plan? | |
|---|---|---|---|---|
| Datadog | All-in-one cloud observability | $31 per host per month | Free trial | Visit |
| New Relic | Usage-based observability | See website | Yes | Visit |
| Dynatrace | Enterprise root cause analysis | $58 per host per month | Free trial | Visit |
 Sentry | Error tracking plus APM | $26 per month | Yes | Visit |
 Grafana Cloud | Open-source observability | $19 per month | Yes | Visit |
 Splunk Observability | Splunk portfolio teams | $55 per host per month | Free trial | Visit |
 Honeycomb | Trace-first debugging | $150 per month | Yes | Visit |
 SigNoz | Self-hosted open-source APM | $49 per month | Yes | Visit |
The best application performance monitoring software
Application performance monitoring software tracks response times, error rates, traces and infrastructure signals so teams can find slow code before users complain. We compared official pricing pages, documentation and public reviews, and we favored tools that support OpenTelemetry, clear pricing and practical alerting.
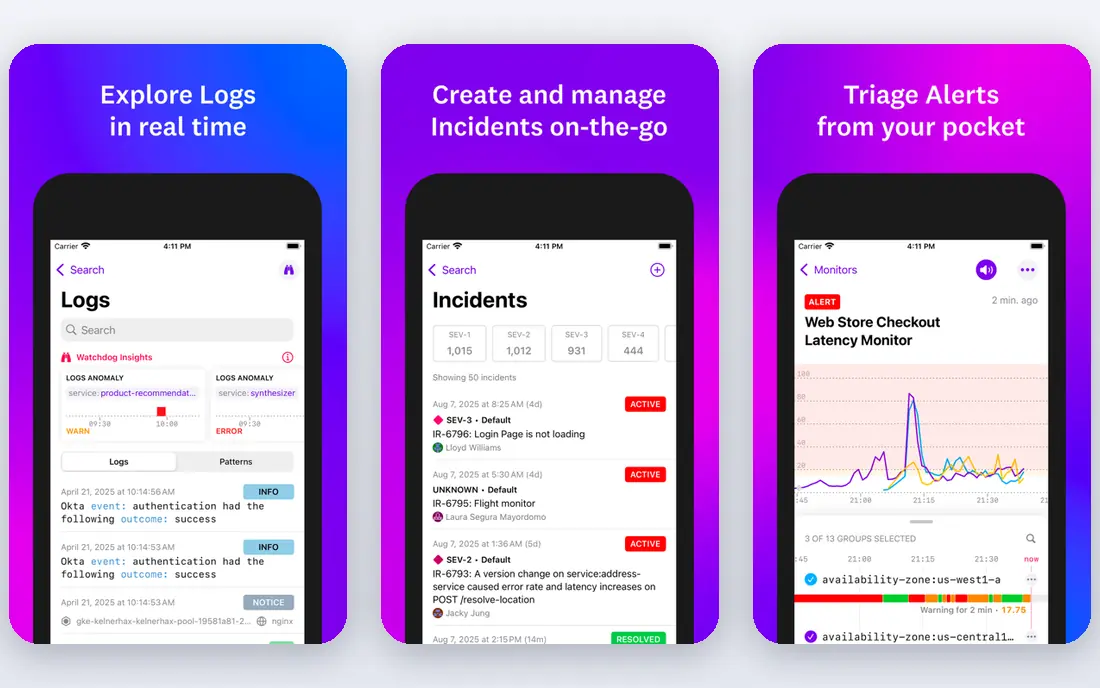
Datadog is our pick for cloud-native teams that want infrastructure, APM, logs and security signals in one platform. APM at $31 per host a month in recent comparisons sits alongside infrastructure monitoring at $15 per host, with hundreds of integrations for AWS, GCP, Azure and common frameworks. Dashboards, monitors and notebooks make it easy for a team to move from an alert to a trace to a log.
The cost model is the main risk. Hosts, custom metrics, logs and add-ons each add to the bill, so a growing fleet can surprise a finance team. Datadog is best when engineering time is worth more than the invoice and when one vendor for observability saves real operational effort.
- Broad product coverage
- Many integrations
- Strong dashboards and alerts
- Per-host plus per-unit pricing compounds at scale
- Bill needs active management

New Relic is the best starting point for startups and cost-conscious teams because the free tier includes 100 GB of data ingest a month and full APM features. Pricing is mainly by data ingested, at about $0.40 per GB in recent comparisons, plus per-user platform fees on higher tiers. That model suits teams with few hosts but many engineers, or workloads that vary by season.
The catch is that user fees and data volume can grow together, so a large team with heavy logs can still face a large bill. Set data limits, drop noisy logs early, and review ingest by service each month to keep costs predictable.
- 100 GB free ingest a month
- Full APM included
- Usage-based pricing suits variable workloads
- Per-user platform fees add cost at scale
- Data pricing needs careful forecasting

Dynatrace suits large enterprises with complex hybrid environments where manual tracing is too slow. OneAgent discovers services automatically, and the platform links traces, metrics and logs to a probable root cause rather than leaving engineers to correlate signals by hand. Recent comparisons put full-stack monitoring at about $58 per 8 GB host a month.
That power comes at a price that small teams will find hard to justify, and the consumption-based model takes time to learn. For large, regulated or multi-cloud estates, Dynatrace can pay for itself in faster incident resolution, but a pilot with real services is essential before a wide rollout.
- Automatic discovery with OneAgent
- Strong causal root cause analysis
- Hybrid and cloud support
- High price for small teams
- Consumption model needs training to forecast
Sentry is best known for error tracking, and its APM features make it a strong developer-led choice. It groups errors, links them to releases and commits, and shows slow transactions alongside the code that caused them. Paid plans start at $26 a month, with a free tier covering small apps.
Sentry is not a replacement for Datadog or Dynatrace when full infrastructure monitoring is needed. It pairs well with Grafana Cloud or a cloud provider monitor, giving developers fast error context while platform teams watch hosts and networks elsewhere.
- Excellent error grouping and release tracking
- APM for transactions
- Generous free tier for small apps
- Not a full infrastructure platform
- High event volumes need higher tiers
Grafana Cloud is the best choice for teams already using Prometheus, Loki, Tempo or OpenTelemetry. The free tier covers small teams, and paid plans start at $19 a month plus usage for data beyond free limits. Dashboards are flexible, and the open-source roots make it easier to move data or self-host later.
The trade-off is operational skill. Grafana Cloud is less of a single-agent, fully automatic product than Dynatrace, and log and trace usage needs monitoring. For platform teams that value openness and control, it offers a strong balance of price and power.
- Strong free tier
- Open-source stack compatibility
- Flexible dashboards
- Usage-based costs for logs and traces
- Setup takes more skill than a single-agent platform
Splunk Observability Cloud suits enterprises already using Splunk for logs or security, because it keeps observability data and workflows in one portfolio. Recent comparisons put pricing at about $55 per host a month, with trial access for evaluation. Analytics, alerting and dashboards are strong for large, data-heavy environments.
Outside a Splunk estate, the price and complexity are harder to justify against Datadog or New Relic. Choose Splunk Observability when integration with existing Splunk data is a priority, not simply for APM alone.
- Strong analytics and alerting
- Fits Splunk log and security estates
- Enterprise support
- High per-host price
- Best value only inside a Splunk portfolio
Honeycomb is built for debugging complex distributed systems, where the question is not only that a request was slow, but which combination of user, service and feature made it slow. High-cardinality tracing and fast queries let engineers slice traces in ways that metric-only tools cannot. Paid plans start at $150 a month, with a free tier for small event volumes.
The price and event model mean Honeycomb is best for teams with real debugging pain in microservices, rather than for simple uptime monitoring. For those teams, it can shorten incident investigations in a way that justifies the cost.
- Excellent high-cardinality tracing
- Fast query for debugging
- Free tier for small teams
- $150 starting price is high for small apps
- Event-based pricing needs volume planning
SigNoz is the best open-source APM choice for teams that want Datadog-style traces, metrics and logs without a closed platform. It supports OpenTelemetry, offers a self-hosted option, and cloud plans start at $49 a month plus usage. That combination appeals to startups and platform teams that want to control data and avoid lock-in.
Self-hosting requires operations work for storage, upgrades and scaling, so small teams should test the cloud plan first. For teams with platform engineering capacity, SigNoz offers a credible, lower-cost path to full observability.
- Open-source APM with traces, metrics and logs
- Self-hosting option
- No vendor lock-in
- Self-hosting needs operations skill
- Cloud pricing is usage-based
How we picked these
We compared official pricing pages, documentation and public reviews, and we favored tools that support modern tracing, alerting and OpenTelemetry. A tool qualified if it could monitor application performance in production, if pricing was published or clearly described, and if it was actively maintained. We also noted the billing model for each tool, because hosts, data and users produce very different bills at scale.
How to choose APM software without a surprise bill
Start by instrumenting with OpenTelemetry where possible, so you can change vendors without rewriting code. Then send data to a tool that fits your fleet: host-based pricing for few hosts and many engineers, data-based pricing for variable workloads, and event-based pricing for trace-heavy debugging. Set spending limits before the first large ingest, and review the top data sources weekly during the first month.
Also decide what an alert should do. APM value comes from faster detection and root cause analysis, not from dashboards alone. Test alerts with a real incident, check on-call routing, and confirm that traces, logs and metrics link together. A tool that shows a slow request but not the code path behind it will not shorten your next outage.
FAQ
What is the best application performance monitoring software?
Datadog is best for all-in-one cloud observability, New Relic is best for usage-based pricing, and Dynatrace is best for enterprise root cause analysis. The best application performance monitoring tool depends on fleet size, data volume and team skill.
What are the best application performance monitoring tools for startups?
New Relic free tier, Sentry free tier and Grafana Cloud free tier cover many startup needs at low cost. Start with OpenTelemetry instrumentation, then add a paid plan only when data volume or team size requires it.
How much does APM software cost?
Prices range from free tiers to $31 to $58 per host a month for leading platforms, plus data and user fees. Mid-size deployments often cost $500 to $2,000 a month, while large enterprises can pay far more, so forecast by hosts, data and users.
What is the difference between APM and observability?
APM focuses on application response times, errors and throughput, while observability is broader and covers traces, metrics and logs across the whole system. Most modern APM tools now cover both, but the terms still describe different scopes.
Should I use OpenTelemetry or a vendor agent?
OpenTelemetry gives vendor-neutral instrumentation and easier switching, while vendor agents often offer deeper auto-instrumentation. Many teams use OpenTelemetry for custom code and vendor agents for infrastructure, which balances control and convenience.
Can I use multiple APM tools together?
Yes, for example Sentry for errors plus Grafana Cloud for metrics and traces. OpenTelemetry makes this easier, but each extra tool adds cost and maintenance, so keep the stack as small as the job allows.