Best AI Data Visualization Tools in 2026: 8 Tools Compared
We compared the best AI data visualization tools, from Tableau and Power BI to Julius AI, Akkio, Flourish, and Datawrapper, for charts and insight today.
- Editor's choice
 Tableau
Enterprise dashboards
Starts atSee websiteVisit tableau.comFull review - Great alternative
 Microsoft Power BI
Microsoft dashboards
Starts atSee websiteVisit powerbi.microsoft.comFull review - Also consider
 Julius AI
Plain-language data analysis
Starts atSee websiteVisit julius.aiFull review
TL;DR:
- Tableau and Power BI remain the strongest choices when you need governed, shared dashboards at company scale.
- Julius AI is our pick for quick analysis, because you can ask questions in plain language and get charts and explanations.
- Flourish and Datawrapper are best for publishing clean charts and stories on the web without a full BI setup.
- AI chart tools can misread data or invent a trend, so always check the numbers behind a chart before you share it.
- The best tool depends on whether your audience is an executive dashboard, a published article, or a one-off analysis.
Quick comparison
| Tool | Best for | Starts at | Free plan? | |
|---|---|---|---|---|
| Tableau | Enterprise dashboards | See website | Free trial | Visit |
| Microsoft Power BI | Microsoft dashboards | See website | Yes | Visit |
| Julius AI | Plain-language data analysis | See website | Yes | Visit |
 Akkio | AI forecasting and reports | See website | Free trial | Visit |
 Polymer | AI dashboards from sheets | See website | Free trial | Visit |
 Flourish | Published interactive charts | Free | Yes | Visit |
 Datawrapper | Newsroom charts and maps | Free | Yes | Visit |
 Luzmo | Embedded AI dashboards | See website | Free trial | Visit |
The best AI data visualization tools
We looked for tools that use AI to suggest charts, explain trends, or turn questions into visuals, while still letting you check the underlying data. Here are eight that cover BI, analysis, and publishing.
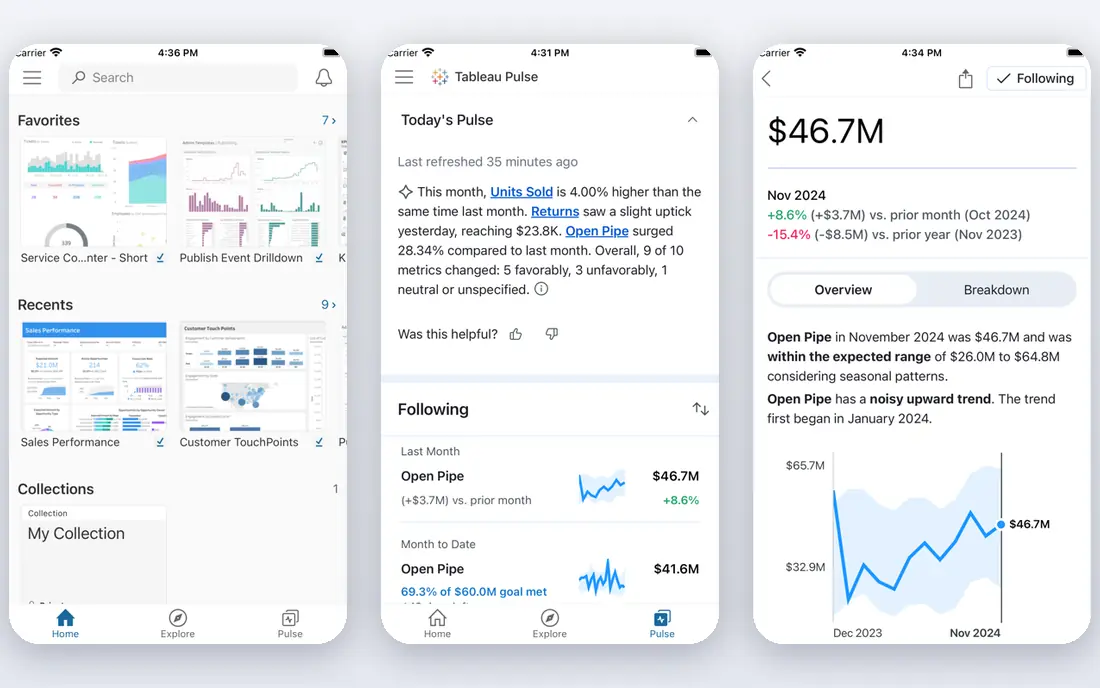
Tableau is a long-standing BI tool for visual analysis. You can connect to databases, spreadsheets, and cloud sources, build interactive dashboards, and share them across a company. AI features help explain a chart, summarize a view, and suggest next steps, but the core strength remains visual exploration.
The main challenge is licensing. Tableau offers Creator, Explorer, and Viewer roles with different prices, so check the current Tableau pricing page for your team size and needs. For a large organization that needs governed dashboards, Tableau is still a top choice. For a single analyst, a simpler tool may be faster.
- Strong visual analysis and dashboards
- AI features for explanations and summaries
- Wide data connectors
- Pricing and licensing are complex
- Learning curve for new users

Power BI suits teams already using Excel, Teams, and Azure. Power BI Desktop is free for building reports, and the service lets you share dashboards and set up scheduled refresh. Copilot and other AI features can help summarize data and suggest visuals, with availability depending on license and capacity.
Sharing is the cost to watch. Viewers and collaborators often need a Pro license or Premium capacity, so a free Desktop report does not mean free sharing for a whole company. Check current Power BI pricing before you plan a rollout, and test sharing with a small group first.
- Deep Microsoft 365 integration
- Strong DAX and modeling
- Free Desktop app
- Sharing needs paid capacity or Pro licenses
- Some features are Windows-focused

Julius AI is built for analysts who want answers without writing code for every chart. You upload a spreadsheet or connect a source, ask a question in plain language, and get a chart, a table, and a written explanation. That workflow suits one-off analysis, such as sales by region or churn by cohort.
The key caution applies to all AI analysis tools: check the numbers. Julius can misread a column, filter the wrong rows, or present a correlation as a cause. Always look at the data behind a chart, and rerun a question with a clearer prompt if the result looks odd. Check current Julius pricing for free limits and paid plans.
- Ask questions in plain language
- Charts, tables, and explanations
- Works with spreadsheets and files
- Results need verification
- Free plan has usage limits
Akkio focuses on making AI analysis accessible to business users. You can upload data, ask questions in chat, build forecasts, and generate reports without writing code. It suits teams that want predictions and summaries, such as sales forecasts or customer segments, without a data science team.
Forecasts are only as good as the data behind them. Validate a model on past data, check for missing values or outliers, and do not present a forecast as a certainty. Use the free trial to test Akkio on a dataset you already understand, so you can judge whether its answers match known results.
- No-code forecasting and classification
- Chat-based analysis
- Business reports from data
- Aimed at business users, not full BI
- Model results need validation
Polymer turns a spreadsheet into a shareable dashboard with AI insights. You connect Google Sheets or upload a file, and Polymer suggests charts, highlights trends, and lets viewers search the data in plain language. That speed suits startups and small teams that live in sheets.
Polymer is not a replacement for a full BI platform with complex data modeling and governance. It is a good middle step between a static spreadsheet and a governed dashboard. Check current Polymer pricing and trial terms, and test it with your largest sheet before you rely on it for reporting.
- Fast dashboards from spreadsheets
- AI insights and search
- Sharing without a BI setup
- Less powerful than Tableau or Power BI for complex modeling
- Plan limits need checking
Flourish is a publishing tool for interactive charts, maps, and data stories. Journalists, nonprofits, and marketing teams use its templates to build a chart that readers can explore, then embed it on a website. The free plan covers many templates and is enough to test the core workflow.
Flourish does not replace a BI tool for analysis. You clean and prepare data elsewhere, then use Flourish to present it well. That separation is a benefit for publishers, because the focus stays on clear, readable visuals. Check Flourish pricing for team and enterprise features if you need private projects or collaboration.
- Beautiful interactive charts and stories
- Templates for maps, bars, and scatter plots
- Easy embedding
- AI features are limited compared with BI tools
- Data work happens outside Flourish
Datawrapper is built for clear, honest charts in news and reports. You paste or upload data, choose a chart or map, and publish an embed that looks good on desktop and mobile. The design defaults are restrained, which helps readers focus on the data rather than decoration.
The simplicity is deliberate. Datawrapper does not try to be a full BI platform, and advanced modeling belongs in another tool. For a team that publishes charts regularly, Datawrapper is fast, consistent, and easy to learn. The free plan is useful, with paid plans adding collaboration and customization.
- Clean, readable charts
- Maps and tables included
- Fast embedding for articles
- Design options are intentionally simple
- Advanced analysis needs another tool
Luzmo, formerly Cumul.io, helps software teams embed dashboards inside their own products. Customers see charts and AI-generated insights without leaving the app, and developers control styling and permissions through an API. That embedded focus sets Luzmo apart from Tableau and Power BI, which are mainly for internal reporting.
Luzmo suits product teams rather than a solo analyst making one chart. Check current Luzmo pricing and trial terms, and test embedding with a small dashboard before you commit. For a SaaS product that needs customer-facing analytics, Luzmo is a strong, focused option.
- Embedded dashboards for products
- AI chart generation
- Developer-friendly API
- Aimed at product teams, not solo analysts
- Pricing needs checking
How we picked these
We compared official feature pages, pricing pages, and documentation for AI visualization tools available today. We favored tools that produce editable charts, explain their results, and let you check source data. We included BI platforms, AI analysis tools, and publishing tools because visualization needs differ by audience. We did not claim hands-on testing that did not happen, and we used See website where a price could not be verified at writing time.
How to choose an AI visualization tool without misleading readers
Start with the audience. An executive needs a governed dashboard with consistent definitions, while a reader of an article needs one clear chart with a source note. A tool that is perfect for one audience can be wrong for the other.
Next, check the data pipeline. AI suggestions are only useful if the underlying data is clean, current, and defined the same way each time. A chart that mixes definitions or double-counts rows will mislead, no matter how polished it looks. Document definitions and date ranges on the dashboard itself.
Finally, verify every AI-generated insight. Ask the tool to show the underlying table, check totals against a known source, and look for outliers that could distort a trend. If an insight cannot be traced to data you can inspect, do not publish it. A simple, verified chart beats a clever, unverified AI summary.
FAQ
What are the best AI data visualization tools?
Tableau and Power BI are best for governed company dashboards, while Julius AI is best for quick plain-language analysis. Flourish and Datawrapper are best for published charts, and Luzmo is best for embedded dashboards in a product. Choose based on audience and sharing needs.
What is the best AI tool for data visualization for beginners?
Julius AI and Polymer are good for beginners because they accept plain-language questions and spreadsheet uploads. Flourish and Datawrapper are also beginner-friendly for publishing charts. Start with a small, clean dataset and check every chart against the source data.
Can AI create charts from a spreadsheet?
Yes. Julius AI, Polymer, and Akkio can take a spreadsheet and suggest charts or answer questions about it. Tableau and Power BI can also connect to spreadsheets for dashboards. Always check column types, filters, and totals, because AI tools can misread messy spreadsheet data.
Is Tableau better than Power BI?
Tableau is often preferred for visual exploration and design flexibility, while Power BI is often preferred inside Microsoft 365 for cost and integration. The better choice depends on your existing tools, sharing needs, and licensing budget. Test both with the same dataset before you decide.
How do I avoid misleading charts from AI tools?
Show the source data, date range, and definitions alongside the chart. Check totals, look for outliers, and avoid truncated axes that exaggerate small changes. If an AI insight cannot be traced to data you can inspect, leave it out of a published chart.