Best Alternatives to Datadog for Observability in 2026: 8 Tools Compared
Compare the best alternatives to datadog for observability, with current pricing, free tiers, and picks for logs, metrics, traces, and errors in 2026.
- Editor's choice
 New Relic
Usage-based all-in-one
Starts atFreeVisit newrelic.comFull review - Great alternative
 Dynatrace
Enterprise root-cause analysis
Starts atSee websiteVisit dynatrace.comFull review - Also consider
 Grafana Cloud
Open stack visualization
Starts at$19 per monthVisit grafana.comFull review
TL;DR:
- New Relic and Grafana Cloud offer the most useful free tiers for small teams that need metrics, logs, and traces without a large contract.
- Dynatrace suits large enterprises that want automatic root-cause analysis, while Splunk suits teams already invested in Splunk log analytics.
- Honeycomb is the strongest pick for debugging complex distributed traces with high-cardinality data.
- Sentry suits developer teams that need error tracking and performance monitoring in the same workflow.
- SigNoz and Elastic suit teams that want open standards, self-hosting, or control over data location.
Quick comparison
| Tool | Best for | Starts at | Free plan? | |
|---|---|---|---|---|
| New Relic | Usage-based all-in-one | Free | Yes | Visit |
| Dynatrace | Enterprise root-cause analysis | See website | Free trial | Visit |
| Grafana Cloud | Open stack visualization | $19 per month | Yes | Visit |
 Honeycomb | Trace-first debugging | $150 per month | Yes | Visit |
 Sentry | Error and performance tracking | $26 per month | Yes | Visit |
 Elastic Observability | Search-led logs and APM | See website | Free trial | Visit |
 Splunk Observability | Enterprise log analytics | See website | Free trial | Visit |
 SigNoz | OpenTelemetry self-hosting | $49 per month | Yes | Visit |
The best alternatives to Datadog for observability
Datadog covers infrastructure, APM, logs, and security in one platform. These tools match parts of that scope, often at lower cost or with more open standards.

New Relic is the most direct Datadog replacement for teams that want one platform without per-host pricing. The free tier includes 100 GB of data ingest per month and one full user, which lets a small team monitor a real product before paying. APM, infrastructure monitoring, logs, browser and mobile monitoring, and alerts sit in one account, with a query language for custom analysis.
The catch is the usage model. Data volume and full-user seats drive the bill, so a team with heavy logs or many engineers must watch usage and set limits. NRQL also takes time to learn well. For a startup or small team that wants a full platform with a real free start, New Relic is our pick for most readers.
- 100 GB free monthly ingest
- Full-stack APM, logs, and infrastructure
- Broad language support
- Query language takes learning
- Costs rise with data and full users
- Dashboards need design time
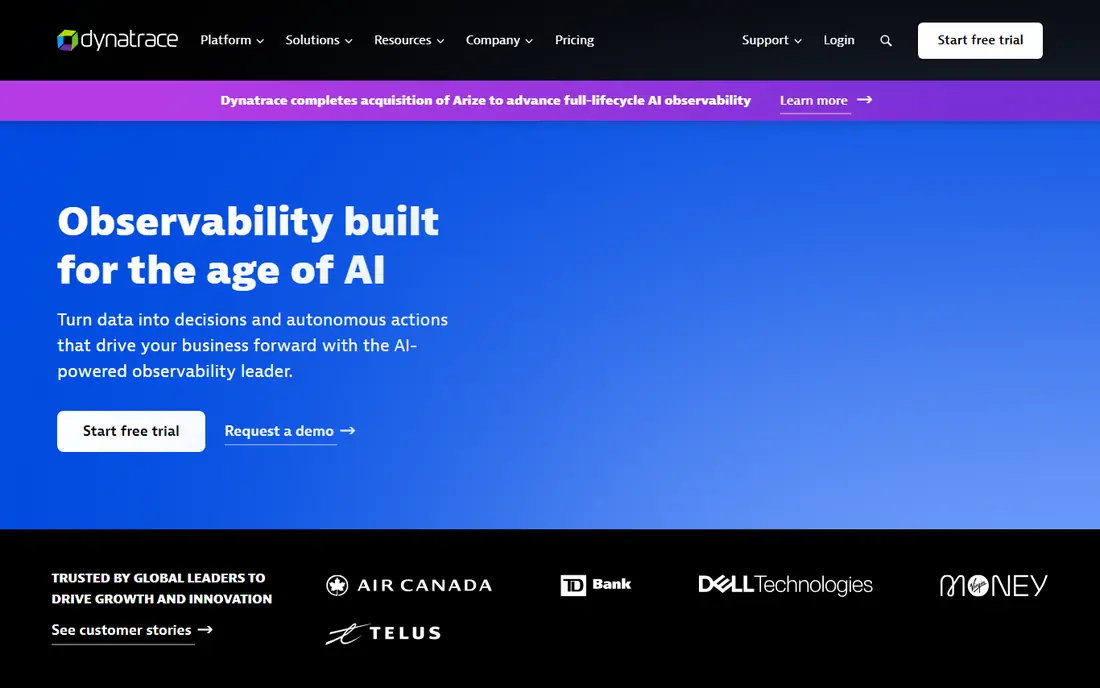
Dynatrace suits large companies that need automatic discovery across thousands of hosts, containers, and cloud services. OneAgent installs once and maps services, dependencies, and infrastructure, while Davis AI links problems to likely causes instead of leaving engineers to sift through alerts. Full-stack monitoring covers infrastructure, APM, logs, synthetic checks, and digital experience in one platform.
Pricing is quote-based and enterprise-level, so small teams will find it costly and heavy for simple needs. A trial helps, but a sales conversation is needed for a real quote. For a large enterprise that values automatic root-cause work and broad coverage, Dynatrace is a leading Datadog alternative.
- Automatic discovery and Davis AI root-cause analysis
- Broad enterprise coverage
- Managed self-host option
- Quote-based pricing
- Enterprise cost level
- Setup needs planning for large estates
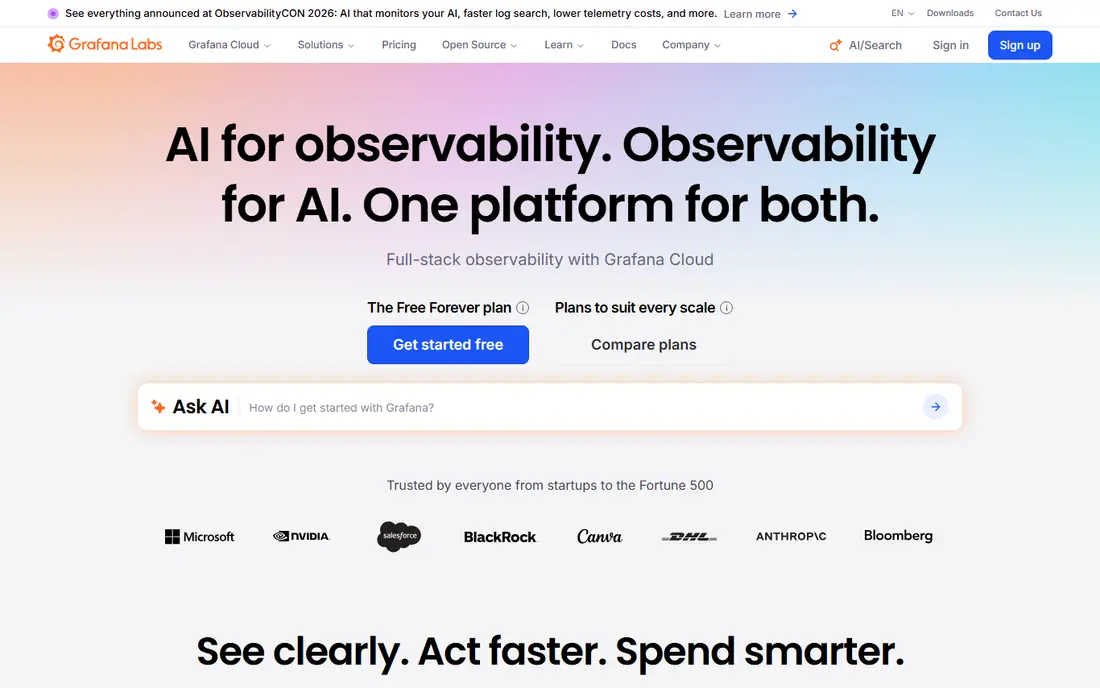
Grafana Cloud is the pick for teams built on open standards. Dashboards, alerts, and exploration tools cover metrics from Prometheus, logs from Loki, traces from Tempo, and profiles, with OpenTelemetry support throughout. The free tier covers small use, and paid plans start at $19 per month plus usage for active series, logs, and traces.
Grafana Cloud is a platform to assemble, not a single agent that discovers everything at once. Teams must instrument apps with OpenTelemetry or Prometheus exporters and design dashboards themselves. For engineering-led teams that want to avoid vendor lock-in and control their stack, Grafana Cloud offers strong value and flexibility.
- Strong dashboards for Prometheus and logs
- Open standards support
- Generous free tier for small use
- Assembly needed for a full stack
- Usage costs for series and logs
- Support depth varies by tier
Honeycomb is built for a specific hard problem, which is debugging slow or failing requests across many microservices. Engineers can slice traces by user, request, service, or custom fields with high cardinality, and ask new questions without pre-aggregating data away. That workflow helps teams find why one request failed when dashboards show only averages.
Honeycomb is less of a general infrastructure monitor than Datadog or Dynatrace, so teams often pair it with Grafana, New Relic, or a host monitor. Pro pricing starts at $150 per month, with a free tier for smaller event volumes. For a team whose main pain is distributed debugging, Honeycomb is the most focused tool on this list.
- High-cardinality trace exploration
- Fast query for debugging
- Good for microservices
- Pro pricing starts higher than some rivals
- Infrastructure monitoring is thinner
- Needs good instrumentation
Sentry fits developer teams that live in code and releases. Errors group by cause, link to a release and a code location, and show the context needed to fix a bug, while performance monitoring tracks slow transactions and spans. SDKs cover most common languages and frameworks, and setup is fast compared with a full observability platform.
Sentry does not replace host, network, or log monitoring at Datadog scale, so infrastructure teams will need another tool for that layer. Team pricing starts at $26 per month when billed annually, with a free developer tier for small use. For error-first teams, Sentry is an excellent complement or a focused Datadog alternative for app health.
- Clear error grouping and release tracking
- Performance monitoring
- Wide SDK support
- Not a full infrastructure monitor
- Event volume drives cost
- Log depth is thinner than Splunk
Elastic Observability builds on the Elasticsearch stack, which many teams already use for log search. APM agents, logs, metrics, and uptime checks feed into a search-led interface where engineers can query raw events in detail. Cloud hosting and self-managed deployment both exist, which helps teams with data location or cost requirements.
Self-hosting Elastic at scale needs real engineering effort for storage, retention, and cluster health, and cloud pricing should be confirmed on the vendor page. For log-heavy teams that value search depth and control, Elastic is a strong alternative. For teams that want a fully managed agent-first platform, New Relic or Dynatrace may be simpler.
- Strong search across logs and traces
- Self-host option
- Mature APM agents
- Resource needs for self-hosting
- Pricing needs a vendor check
- Setup takes engineering time
Splunk Observability suits enterprises that already use Splunk for logs, security, or IT operations. Observability Cloud adds APM, infrastructure monitoring, and real user monitoring to that log foundation, with dashboards and alerts that tie app performance to log evidence. Teams with Splunk skills can reuse queries and data pipelines across use cases.
Pricing is quote-based and can be complex, since it depends on hosts, data volume, and product mix. Smaller teams may find the cost and setup heavy for basic monitoring. For a Splunk-centered enterprise that wants observability without adding a separate vendor, Splunk is a logical and capable choice.
- Deep log analytics and security links
- Strong enterprise reporting
- Broad integrations
- Quote-based pricing
- Complex pricing model
- Learning curve for query language
SigNoz is an open source observability platform built around OpenTelemetry, with metrics, logs, and traces in one interface. Teams can self-host for free, which suits cost-conscious groups and teams that must keep data in their own cloud. SigNoz Cloud starts at $49 per month for teams that prefer managed hosting without running the stack themselves.
The ecosystem is younger than Grafana, so some integrations and community resources are thinner, and self-hosting still needs monitoring and upgrades. For a team that wants open standards, a single pane for signals, and a clear exit path, SigNoz is a strong modern alternative. Pair it with Sentry for errors if your team needs deeper release tracking.
- OpenTelemetry-native metrics, logs, and traces
- Self-host free
- Cloud option from $49 per month
- Younger ecosystem than Grafana
- Self-hosting needs ops work
- Enterprise features vary by tier
How we picked these
We compared official pricing and feature pages for observability platforms that cover metrics, logs, traces, or APM in a way that maps to Datadog work. We checked free tiers, entry prices, and deployment options as listed in October 2026, and we used See website where pricing is quote-based or usage-led. We did not claim hands-on testing, and we favored tools with current OpenTelemetry support and clear free or trial access.
What to check before you switch
Observability bills follow data volume, hosts, and users, so price your real telemetry before you commit.
Price by your meter, not the headline
Datadog prices largely by host, New Relic by data and users, Grafana by series and data, and Honeycomb by events. Estimate your monthly hosts, log volume, trace volume, and team size, then compare two or three vendors on the same workload. Set usage alerts and retention limits early, since a noisy service can double a bill in a week.
Instrument once with OpenTelemetry
Instrument apps with OpenTelemetry where possible, so you can send the same telemetry to Grafana, SigNoz, New Relic, or Honeycomb during a trial. That approach lets you compare dashboards and query speed on real data without rewriting instrumentation for each vendor. Check SDK support for your languages before choosing.
Test an incident, not just a dashboard
Run a trial incident, such as a slow endpoint or a failing deploy, and time how long it takes to find the cause in each tool. Check alert routing, on-call integration, and log-to-trace linking during that test. A tool with pretty dashboards but slow incident debugging will cost more in downtime than it saves in license fees.
FAQ
Which Datadog alternative is best for a small team?
New Relic is the best small-team starting point, thanks to its 100 GB free ingest tier and full-stack coverage. Grafana Cloud is a strong second pick for open-stack teams, and Sentry suits developer-led teams focused on errors. Start free, then compare usage costs on real traffic.
Is there a free Datadog alternative?
Yes, in part. New Relic, Grafana Cloud, Honeycomb, Sentry, and SigNoz offer free tiers or free self-hosting, with limits on data, users, or events. No free tier matches Datadog enterprise coverage in full, but small products can often run on a free tier plus one paid tool for gaps.
Which tool is best for microservices debugging?
Honeycomb is best for high-cardinality trace debugging across microservices, since it lets engineers slice traces by many fields. Grafana Tempo and SigNoz also support trace exploration with open standards. Choose Honeycomb when trace questions are the main pain, and Grafana or SigNoz when open tooling matters more.
Do I need to replace all of Datadog at once?
No. Many teams replace one signal at a time, such as errors with Sentry, traces with Honeycomb, or dashboards with Grafana, while keeping Datadog for the rest. Use OpenTelemetry to avoid lock-in, and retire Datadog modules only after the replacement passes a real incident test.
How do I control observability costs?
Set retention limits, sample high-volume traces, drop noisy logs, and alert on usage thresholds. Review cardinality, since a new label on every metric can raise costs fast on series-based pricing. Revisit ingest rules monthly, and remove debug logging from production services when it is no longer needed.